Pipes Feed Preview: Towards Data Science & The New Stack & DevOps & SRE & DevOps.com & Google DeepMind Blog
Load-Testing LLMs Using LLMPerf
Fri, 18 Apr 2025 07:44:17 -0000
Benchmark Claude 3 Sonnet on Amazon Bedrock
The post Load-Testing LLMs Using LLMPerf appeared first on Towards Data Science.
<p class="wp-block-paragraph"><mdspan datatext="el1744962075287" class="mdspan-comment">Deploying your Large</mdspan> Language Model (LLM) is not necessarily the final step in productionizing your Generative AI application. An often forgotten, yet crucial part of the MLOPs lifecycle is properly <a href="https://www.opentext.com/what-is/load-testing">load testing</a> your LLM and ensuring it is ready to withstand your expected production traffic. Load testing at a high level is the practice of testing your application or in this case your model with the traffic it would be expecting in a production environment to ensure that it’s performant.</p> <p class="wp-block-paragraph">In the past we’ve discussed <a href="https://towardsdatascience.com/why-load-testing-is-essential-to-take-your-ml-app-to-production-faab0df1c4e1/">load testing traditional ML models</a> using open source Python tools such as <a href="https://locust.io/">Locust</a>. Locust helps capture general performance metrics such as requests per second (RPS) and latency percentiles on a per request basis. While this is effective with more traditional APIs and ML models it doesn’t capture the full story for LLMs. </p> <p class="wp-block-paragraph">LLMs traditionally have a much lower RPS and higher latency than traditional ML models due to their size and larger compute requirements. In general the RPS metric does not really provide the most accurate picture either as requests can greatly vary depending on the input to the LLM. For instance you might have a query asking to summarize a large chunk of text and another query that might require a one-word response. </p> <p class="wp-block-paragraph">This is why <a href="https://learn.microsoft.com/en-us/dotnet/ai/conceptual/understanding-tokens">tokens</a> are seen as a much more accurate representation of an LLM’s performance. At a high level a token is a chunk of text, whenever an LLM is processing your input it “tokenizes” the input. A token differs depending specifically on the LLM you are using, but you can imagine it for instance as a word, sequence of words, or characters in essence.</p> <figure class="wp-block-image size-large"><img decoding="async" src="https://contributor.insightmediagroup.io/wp-content/uploads/2025/04/image-58-1024x198.png" alt="" class="wp-image-601771"/><figcaption class="wp-element-caption">Image by Author</figcaption></figure> <p class="wp-block-paragraph">What we’ll do in this article is explore how we can generate token based metrics so we can understand how your LLM is performing from a serving/deployment perspective. After this article you’ll have an idea of how you can set up a load-testing tool specifically to benchmark different LLMs in the case that you are evaluating many models or different deployment configurations or a combination of both.</p> <p class="wp-block-paragraph">Let’s get hands on! If you are more of a video based learner feel free to follow my corresponding YouTube video down below:</p> <figure class="wp-block-embed is-type-video is-provider-youtube wp-block-embed-youtube wp-embed-aspect-4-3 wp-has-aspect-ratio"><div class="wp-block-embed__wrapper"> <iframe title="2025 Guide to Load Testing LLMs | Claude Sonnet on Amazon Bedrock" width="500" height="375" src="https://www.youtube.com/embed/AbirlC9gLUE?start=2&feature=oembed" frameborder="0" allow="accelerometer; autoplay; clipboard-write; encrypted-media; gyroscope; picture-in-picture; web-share" referrerpolicy="strict-origin-when-cross-origin" allowfullscreen></iframe> </div></figure> <p class="wp-block-paragraph"><strong>NOTE</strong>: This article assumes a basic understanding of Python, LLMs, and Amazon Bedrock/SageMaker. If you are new to Amazon Bedrock please refer to my starter guide <a href="https://www.youtube.com/watch?v=8aMJUV0qhow&t=3s">here</a>. If you want to learn more about SageMaker JumpStart LLM deployments refer to the video <a href="https://www.youtube.com/watch?v=c0ASHUm3BwA&t=636s">here</a>.</p> <p class="wp-block-paragraph"><strong>DISCLAIMER</strong>: I am a Machine Learning Architect at AWS and my opinions are my own.</p> <h3 class="wp-block-heading">Table of Contents</h3> <ol class="wp-block-list"> <li class="wp-block-list-item">LLM Specific Metrics</li> <li class="wp-block-list-item">LLMPerf Intro</li> <li class="wp-block-list-item">Applying LLMPerf to Amazon Bedrock</li> <li class="wp-block-list-item">Additional Resources & Conclusion</li> </ol> <h2 class="wp-block-heading">LLM-Specific Metrics</h2> <p class="wp-block-paragraph">As we briefly discussed in the introduction in regards to LLM hosting, token based metrics generally provide a much better representation of how your LLM is responding to different payload sizes or types of queries (summarization vs QnA). </p> <p class="wp-block-paragraph">Traditionally we have always tracked RPS and latency which we will still see here still, but more so at a token level. Here are some of the metrics to be aware of before we get started with load testing:</p> <ol class="wp-block-list"> <li class="wp-block-list-item"><strong>Time to First Token</strong>: This is the duration it takes for the first token to generate. This is especially handy when streaming. For instance when using ChatGPT we start processing information when the first piece of text (token) appears.</li> <li class="wp-block-list-item"><strong>Total Output Tokens Per Second</strong>: This is the total number of tokens generated per second, you can think of this as a more granular alternative to the requests per second we traditionally track.</li> </ol> <p class="wp-block-paragraph">These are the major metrics that we’ll focus on, and there’s a few others such as inter-token latency that will also be displayed as part of the load tests. Keep in mind the parameters that also influence these metrics include the expected input and output token size. We specifically play with these parameters to get an accurate understanding of how our LLM performs in response to different generation tasks. </p> <p class="wp-block-paragraph">Now let’s take a look at a tool that enables us to toggle these parameters and display the relevant metrics we need.</p> <h2 class="wp-block-heading">LLMPerf Intro</h2> <p class="wp-block-paragraph">LLMPerf is built on top of <a href="https://github.com/ray-project/ray">Ray</a>, a popular distributed computing Python framework. LLMPerf specifically leverages Ray to create distributed load tests where we can simulate real-time production level traffic. </p> <p class="wp-block-paragraph">Note that any load-testing tool is also only going to be able to generate your expected amount of traffic if the client machine it is on has enough compute power to match your expected load. For instance as you scale the concurrency or throughput expected for your model, you’d also want to scale the client machine(s) where you are running your load test.</p> <p class="wp-block-paragraph">Now specifically within <a href="https://github.com/ray-project/llmperf">LLMPerf</a> there’s a few parameters that are exposed that are tailored for LLM load testing as we’ve discussed:</p> <ul class="wp-block-list"> <li class="wp-block-list-item"><strong>Model</strong>: This is the model provider and your hosted model that you’re working with. For our use-case it’ll be <a href="https://aws.amazon.com/bedrock/?trk=0eaabb80-ee46-4e73-94ae-368ffb759b62&sc_channel=ps&ef_id=Cj0KCQjwzYLABhD4ARIsALySuCRjoAi5pM0Mqz39YZd4i9YhVEBCQi7FFzshxslxIvrxgcl1lWipOvoaAl9BEALw_wcB:G:s&s_kwcid=AL!4422!3!692006004688!p!!g!!amazon%20bedrock!21048268554!159639952935&gclid=Cj0KCQjwzYLABhD4ARIsALySuCRjoAi5pM0Mqz39YZd4i9YhVEBCQi7FFzshxslxIvrxgcl1lWipOvoaAl9BEALw_wcB">Amazon Bedrock</a> and <a href="https://www.anthropic.com/news/claude-3-5-sonnet">Claude 3 Sonnet</a> specifically.</li> <li class="wp-block-list-item"><strong>LLM API</strong>: This is the API format in which the payload should be structured. We use <a href="https://www.litellm.ai/">LiteLLM</a> which provides a standardized payload structure across different model providers, thus simplifying the setup process for us especially if we want to test different models hosted on different platforms.</li> <li class="wp-block-list-item"><strong>Input Tokens</strong>: The mean input token length, you can also specify a standard deviation for this number.</li> <li class="wp-block-list-item"><strong>Output Tokens</strong>: The mean output token length, you can also specify a standard deviation for this number.</li> <li class="wp-block-list-item"><strong>Concurrent Requests</strong>: The number of concurrent requests for the load test to simulate.</li> <li class="wp-block-list-item"><strong>Test Duration</strong>: You can control the duration of the test, this parameter is enabled in seconds.</li> </ul> <p class="wp-block-paragraph">LLMPerf specifically exposes all these parameters through their <a href="https://github.com/ray-project/llmperf/blob/main/token_benchmark_ray.py">token_benchmark_ray.py</a> script which we configure with our specific values. Let’s take a look now at how we can configure this specifically for Amazon Bedrock.</p> <h2 class="wp-block-heading">Applying LLMPerf to Amazon Bedrock</h2> <h3 class="wp-block-heading">Setup</h3> <p class="wp-block-paragraph">For this example we’ll be working in a <a href="https://docs.aws.amazon.com/sagemaker/latest/dg/nbi.html" data-type="link" data-id="https://docs.aws.amazon.com/sagemaker/latest/dg/nbi.html">SageMaker Classic Notebook Instance</a> with a <strong>conda_python3 kernel</strong> and <strong>ml.g5.12xlarge</strong> instance. Note that you want to select an instance that has enough compute to generate the traffic load that you want to simulate. Ensure that you also have your <a href="https://docs.aws.amazon.com/cli/v1/userguide/cli-configure-files.html" data-type="link" data-id="https://docs.aws.amazon.com/cli/v1/userguide/cli-configure-files.html">AWS credentials</a> for LLMPerf to access the hosted model be it on Bedrock or SageMaker.</p> <h3 class="wp-block-heading">LiteLLM Configuration</h3> <p class="wp-block-paragraph">We first configure our LLM API structure of choice which is LiteLLM in this case. With LiteLLM there’s support across various model providers, in this case we configure the <a href="https://docs.litellm.ai/docs/completion">completion API</a> to work with Amazon Bedrock:</p> <pre class="wp-block-prismatic-blocks"><code class="language-python">import os from litellm import completion os.environ["AWS_ACCESS_KEY_ID"] = "Enter your access key ID" os.environ["AWS_SECRET_ACCESS_KEY"] = "Enter your secret access key" os.environ["AWS_REGION_NAME"] = "us-east-1" response = completion( model="anthropic.<a href="https://towardsdatascience.com/tag/claude/" title="claude">claude</a>-3-sonnet-20240229-v1:0", messages=[{ "content": "Who is Roger Federer?","role": "user"}] ) output = response.choices[0].message.content print(output)</code></pre> <p class="wp-block-paragraph">To work with Bedrock we configure the Model ID to point towards Claude 3 Sonnet and pass in our prompt. The neat part with LiteLLM is that messages key has a consistent format across model providers.</p> <p class="wp-block-paragraph">Post-execution here we can focus on configuring LLMPerf for Bedrock specifically.</p> <h2 class="wp-block-heading">LLMPerf Bedrock Integration</h2> <p class="wp-block-paragraph">To execute a load test with LLMPerf we can simply use the provided <a href="https://github.com/ray-project/llmperf/blob/main/token_benchmark_ray.py">token_benchmark_ray.py</a> script and pass in the following parameters that we talked of earlier:</p> <ul class="wp-block-list"> <li class="wp-block-list-item">Input Tokens Mean & Standard Deviation</li> <li class="wp-block-list-item">Output Tokens Mean & Standard Deviation</li> <li class="wp-block-list-item">Max number of requests for test</li> <li class="wp-block-list-item">Duration of test</li> <li class="wp-block-list-item">Concurrent requests</li> </ul> <p class="wp-block-paragraph">In this case we also specify our API format to be LiteLLM and we can execute the load test with a simple shell script like the following:</p> <pre class="wp-block-prismatic-blocks"><code class="language-python">%%sh python llmperf/token_benchmark_ray.py \ --model bedrock/anthropic.claude-3-sonnet-20240229-v1:0 \ --mean-input-tokens 1024 \ --stddev-input-tokens 200 \ --mean-output-tokens 1024 \ --stddev-output-tokens 200 \ --max-num-completed-requests 30 \ --num-concurrent-requests 1 \ --timeout 300 \ --llm-api litellm \ --results-dir bedrock-outputs</code></pre> <p class="wp-block-paragraph">In this case we keep the concurrency low, but feel free to toggle this number depending on what you’re expecting in production. Our test will run for 300 seconds and post duration you should see an output directory with two files representing statistics for each inference and also the mean metrics across all requests in the duration of the test. </p> <p class="wp-block-paragraph">We can make this look a little neater by parsing the summary file with pandas:</p> <pre class="wp-block-prismatic-blocks"><code class="language-python">import json from pathlib import Path import pandas as pd # Load JSON files individual_path = Path("bedrock-outputs/bedrock-anthropic-claude-3-sonnet-20240229-v1-0_1024_1024_individual_responses.json") summary_path = Path("bedrock-outputs/bedrock-anthropic-claude-3-sonnet-20240229-v1-0_1024_1024_summary.json") with open(individual_path, "r") as f: individual_data = json.load(f) with open(summary_path, "r") as f: summary_data = json.load(f) # Print summary metrics df = pd.DataFrame(individual_data) summary_metrics = { "Model": summary_data.get("model"), "Mean Input Tokens": summary_data.get("mean_input_tokens"), "Stddev Input Tokens": summary_data.get("stddev_input_tokens"), "Mean Output Tokens": summary_data.get("mean_output_tokens"), "Stddev Output Tokens": summary_data.get("stddev_output_tokens"), "Mean TTFT (s)": summary_data.get("results_ttft_s_mean"), "Mean Inter-token Latency (s)": summary_data.get("results_inter_token_latency_s_mean"), "Mean Output Throughput (tokens/s)": summary_data.get("results_mean_output_throughput_token_per_s"), "Completed Requests": summary_data.get("results_num_completed_requests"), "Error Rate": summary_data.get("results_error_rate") } print("Claude 3 Sonnet - Performance Summary:\n") for k, v in summary_metrics.items(): print(f"{k}: {v}")</code></pre> <p class="wp-block-paragraph">The final load test results will look something like the following:</p> <figure class="wp-block-image size-full"><img decoding="async" src="https://contributor.insightmediagroup.io/wp-content/uploads/2025/04/image-57.png" alt="" class="wp-image-601770"/><figcaption class="wp-element-caption">Screenshot by Author</figcaption></figure> <p class="wp-block-paragraph">As we can see we see the input parameters that we configured, and then the corresponding results with time to first token(s) and throughput in regards to mean output tokens per second.</p> <p class="wp-block-paragraph">In a real-world use case you might use LLMPerf across many different model providers and run tests across these platforms. With this tool you can use it holistically to identify the right model and deployment stack for your use-case when used at scale.</p> <h2 class="wp-block-heading">Additional Resources & Conclusion</h2> <p class="wp-block-paragraph">The entire code for the sample can be found at this associated <a href="https://github.com/RamVegiraju/load-testing-llms/blob/master/bedrock-claude-benchmark.ipynb">Github repository</a>. If you also want to work with SageMaker endpoints you can find a Llama JumpStart deployment load testing sample <a href="https://github.com/RamVegiraju/load-testing-llms/blob/master/sagemaker-llama-benchmark.ipynb">here</a>. </p> <p class="wp-block-paragraph">All in all load testing and evaluation are both crucial to ensuring that your LLM is performant against your expected traffic before pushing to production. In future articles we’ll cover not just the evaluation portion, but how we can create a holistic test with both components.</p> <p class="wp-block-paragraph">As always thank you for reading and feel free to leave any feedback and connect with me on <a href="https://www.linkedin.com/in/ram-vegiraju-81272b162/">Linkedln</a> and <a href="https://x.com/RamVegiraju">X</a>.</p> <p>The post <a href="https://towardsdatascience.com/601488-2/">Load-Testing LLMs Using LLMPerf</a> appeared first on <a href="https://towardsdatascience.com">Towards Data Science</a>.</p>When Physics Meets Finance: Using AI to Solve Black-Scholes
Fri, 18 Apr 2025 04:09:58 -0000
Here's how to use Physics-Informed Neural Networks to solve Financial Models, with Python.
The post When Physics Meets Finance: Using AI to Solve Black-Scholes appeared first on Towards Data Science.
<blockquote class="wp-block-quote is-layout-flow wp-block-quote-is-layout-flow"> <p class="wp-block-paragraph"><strong><em>DISCLAIMER</em></strong>: This is not financial advice. I’m a PhD in Aerospace Engineering with a strong focus on Machine Learning: I’m <strong>not</strong> a financial advisor. This article is intended solely to demonstrate the power of Physics-Informed Neural Networks (PINNs) in a financial context.</p> </blockquote> <p class="wp-block-paragraph"><mdspan datatext="el1744948982397" class="mdspan-comment">When I was 16</mdspan>, I fell in love with Physics. The reason was simple yet powerful: I thought Physics was <strong><em>fair</em></strong>.</p> <p class="wp-block-paragraph" id="e^x">It never happened that I got an exercise wrong because the speed of light changed overnight, or because suddenly e<sup>x</sup> could be negative. Every time I read a physics paper and thought, <em>“This doesn’t make sense,</em>” it turned out <strong><em>I was the one not making sense.</em></strong></p> <p class="wp-block-paragraph">So, Physics is always fair, and because of that, it’s always <strong><em>perfect</em></strong>. And Physics displays this perfection and fairness through its set of rules, which are known as <strong>differential equations</strong>.</p> <p class="wp-block-paragraph">The simplest differential equation I know is this one:</p> <figure class="wp-block-image aligncenter size-large is-resized"><img decoding="async" src="https://contributor.insightmediagroup.io/wp-content/uploads/2025/04/Differential_Equation-1-1024x559.png" alt="" class="wp-image-601628" style="width:409px;height:auto"/><figcaption class="wp-element-caption">Image made by author</figcaption></figure> <p class="wp-block-paragraph">Very simple: we start here, x<sub>0</sub>=0, at time t=0, then we move with a constant speed of 5 m/s. This means that after 1 second, we are 5 meters (or miles, if you like it best) away from the origin; after 2 seconds, we are 10 meters away from the origin; after 43128 seconds… I think you got it.</p> <p class="wp-block-paragraph">As we were saying, this is written in stone: perfect, ideal, and unquestionable. Nonetheless, imagine this in real life. Imagine you are out for a walk or driving. Even if you try your best to go at a target speed, you will never be able to keep it constant. Your mind will race in certain parts; maybe you will get distracted, maybe you will stop for red lights, most likely a combination of the above. So maybe the simple differential equation we mentioned earlier is not enough. What we could do is to try and predict your location from the differential equation, <strong><em>but</em> with the help of <a href="https://towardsdatascience.com/tag/artificial-intelligence/" title="Artificial Intelligence">Artificial Intelligence</a></strong>.</p> <p class="wp-block-paragraph">This idea is implemented in <a href="https://www.sciencedirect.com/science/article/pii/S0021999118307125">Physics Informed Neural Networks</a> (PINN). We will describe them later in detail, but the idea is that we try to match <em>both</em> the data and what we know from the differential equation that describes the phenomenon. This means that we enforce our solution to generally meet what we expect from Physics. I know it sounds like black magic, I promise it will be clearer throughout the post.</p> <p class="wp-block-paragraph">Now, the big question:</p> <blockquote class="wp-block-quote is-layout-flow wp-block-quote-is-layout-flow"> <p class="wp-block-paragraph">What does Finance have to do with Physics and Physics Informed Neural Networks?</p> </blockquote> <p class="wp-block-paragraph">Well, it turns out that differential equations are not only useful for nerds like me who are interested in the laws of the natural universe, but they can be useful in <strong>financial models</strong> as well. For example, the <strong>Black-Scholes </strong>model uses a differential equation to set the price of a call option to have, given certain quite strict assumptions, a <strong>risk-free portfolio</strong>.</p> <p class="wp-block-paragraph">The goal of this very convoluted introduction was twofold:</p> <ul class="wp-block-list"> <li class="wp-block-list-item">Confuse you just a little, so that you will keep reading <img src="https://s.w.org/images/core/emoji/15.0.3/72x72/1f642.png" alt="🙂" class="wp-smiley" style="height: 1em; max-height: 1em;" /></li> <li class="wp-block-list-item">Spark your curiosity just enough to see where this is all going.</li> </ul> <p class="wp-block-paragraph">Hopefully I managed <img src="https://s.w.org/images/core/emoji/15.0.3/72x72/1f601.png" alt="😁" class="wp-smiley" style="height: 1em; max-height: 1em;" />. If I did, the rest of the article would follow these steps:</p> <ol class="wp-block-list"> <li class="wp-block-list-item">We will discuss the <strong>Black-Scholes model</strong>, its assumptions, and its differential equation</li> <li class="wp-block-list-item">We will talk about <strong>Physics Informed Neural Networks (PINNs),</strong> where they come from, and why they are helpful</li> <li class="wp-block-list-item">We will develop our algorithm that trains a PINN on Black-Scholes using <strong>Python, Torch, </strong>and<strong> OOP.</strong></li> <li class="wp-block-list-item">We will show the results of our algorithm. </li> </ol> <p class="wp-block-paragraph">I’m excited! To the lab! <img src="https://s.w.org/images/core/emoji/15.0.3/72x72/1f9ea.png" alt="🧪" class="wp-smiley" style="height: 1em; max-height: 1em;" /></p> <h2 class="wp-block-heading">1. Black Scholes Model</h2> <blockquote class="wp-block-quote is-layout-flow wp-block-quote-is-layout-flow"> <p class="wp-block-paragraph">If you are curious about the original paper of Black-Scholes, you can find it <a href="https://www.cs.princeton.edu/courses/archive/fall09/cos323/papers/black_scholes73.pdf">here</a>. It’s definitely worth it <img src="https://s.w.org/images/core/emoji/15.0.3/72x72/1f642.png" alt="🙂" class="wp-smiley" style="height: 1em; max-height: 1em;" /></p> </blockquote> <p class="wp-block-paragraph">Ok, so now we have to understand the <a href="https://towardsdatascience.com/tag/finance/" title="Finance">Finance</a> universe we are in, what the variables are, and what the laws are.</p> <p class="wp-block-paragraph">First off, in Finance, there is a powerful tool called a call<strong> option</strong>. The call option gives you the right (not the obligation) to buy a stock at a certain price in the fixed future (let’s say a year from now), which is called the strike<strong> price</strong>.</p> <p class="wp-block-paragraph">Now let’s think about it for a moment, shall we? Let’s say that today the given stock price is $100. Let us also assume that we hold a call option with a $100 strike price. Now let’s say that in one year the stock price goes to $150. That’s amazing! We can use that call option to buy the stock and then immediately resell it! We just made $150 – $150-$100 = $50 profit. On the other hand, if in one year the stock price goes down to $80, then we can’t do that. Actually, we are better off not exercising our right to buy at all, not to lose money.</p> <p class="wp-block-paragraph">So now that we think about it, the idea of <strong>buying a stock</strong> and <strong>selling an option</strong> turns out to be <strong>perfectly complementary</strong>. What I mean is the randomness of the stock price (the fact that it goes up and down) can actually be <strong>mitigated</strong> by holding the right number of options. This is called <strong>delta hedging.</strong></p> <p class="wp-block-paragraph">Based on a set of assumptions, we can derive the <strong>fair option price</strong> in order to have a <strong>risk-free </strong>portfolio. </p> <p class="wp-block-paragraph">I don’t want to bore you with all the details of the derivation (they are honestly not that hard to follow in the original paper), but the differential equation of the risk-free portfolio is this:</p> <figure class="wp-block-image size-large"><img decoding="async" src="https://contributor.insightmediagroup.io/wp-content/uploads/2025/04/Differential_Equation_BS-1024x129.png" alt="" class="wp-image-601650"/></figure> <p class="wp-block-paragraph">Where:</p> <ul class="wp-block-list"> <li class="wp-block-list-item"><code>C</code> is the price of the option at time t</li> <li class="wp-block-list-item"><code>sigma</code> is the volatility of the stock</li> <li class="wp-block-list-item"><code>r</code> is the risk-free rate</li> <li class="wp-block-list-item"><code>t</code> is time (with t=0 now and T at expiration)</li> <li class="wp-block-list-item"><code>S</code> is the current stock price</li> </ul> <p class="wp-block-paragraph">From this equation, we can derive the fair price of the call option to have a risk-free portfolio. The equation is closed and analytical, and it looks like this:</p> <figure class="wp-block-image aligncenter size-large is-resized"><img decoding="async" src="https://contributor.insightmediagroup.io/wp-content/uploads/2025/04/Black_Scholes_Solution-1024x100.png" alt="" class="wp-image-601654" style="width:486px;height:auto"/></figure> <p class="wp-block-paragraph">With:</p> <figure class="wp-block-image aligncenter size-large is-resized" datatext=""><img decoding="async" src="https://contributor.insightmediagroup.io/wp-content/uploads/2025/04/d1_and_d2-1024x378.png" alt="" class="wp-image-601655" style="width:377px;height:auto"/></figure> <p class="wp-block-paragraph">Where N(x) is the cumulative distribution function (CDF) of the standard normal distribution, K is the strike price, and T is the expiration time.</p> <p class="wp-block-paragraph">For example, this is the plot of the <strong>Stock Price (x) </strong>vs<strong> <strong>Call Option</strong> (y)</strong>, according to the Black-Scholes model.</p> <figure class="wp-block-image size-full"><img decoding="async" src="https://contributor.insightmediagroup.io/wp-content/uploads/2025/04/image-49.png" alt="" class="wp-image-601656"/><figcaption class="wp-element-caption">Image made by author</figcaption></figure> <p class="wp-block-paragraph">Now this looks cool and all, but what does it have to do with Physics and PINN? It looks like the equation is analytical, so why PINN? Why AI? Why am I reading this at all? The answer is below <img src="https://s.w.org/images/core/emoji/15.0.3/72x72/1f447.png" alt="👇" class="wp-smiley" style="height: 1em; max-height: 1em;" />:</p> <h2 class="wp-block-heading">2. Physics Informed Neural Networks</h2> <blockquote class="wp-block-quote is-layout-flow wp-block-quote-is-layout-flow"> <p class="wp-block-paragraph">If you are curious about Physics Informed Neural Networks, you can find out in the original paper <a href="http://Physics Informed Neural Networks">here</a>. Again, worth a read. <img src="https://s.w.org/images/core/emoji/15.0.3/72x72/1f642.png" alt="🙂" class="wp-smiley" style="height: 1em; max-height: 1em;" /> </p> </blockquote> <p class="wp-block-paragraph">Now, the equation above is <strong>analytical</strong>, but again, that is an equation of a fair price in an ideal scenario. What happens if we ignore this for a moment and try to guess the price of the option given the stock price and the time? For example, we could use a Feed Forward Neural Network and train it through backpropagation. </p> <p class="wp-block-paragraph">In this training mechanism, we are minimizing the error </p> <p class="wp-block-paragraph"><code>L = |Estimated C - Real C|</code>:</p> <figure class="wp-block-image size-large"><img decoding="async" src="https://contributor.insightmediagroup.io/wp-content/uploads/2025/04/image-50-1024x645.png" alt="" class="wp-image-601671"/><figcaption class="wp-element-caption">Image made by author</figcaption></figure> <p class="wp-block-paragraph">This is fine, and it is the simplest Neural Network approach you could do. The issue here is that we are completely ignoring the Black-Scholes equation. So, is there another way? Can we possibly integrate it?</p> <p class="wp-block-paragraph">Of course, we can, that is, if we set the error to be</p> <p class="wp-block-paragraph"><code>L = |Estimated C - Real C|+ PDE(C,S,t)</code></p> <p class="wp-block-paragraph">Where PDE(C,S,t) is </p> <figure class="wp-block-image size-large"><img decoding="async" src="https://contributor.insightmediagroup.io/wp-content/uploads/2025/04/Differential_Equation_BS-1024x129.png" alt="" class="wp-image-601650"/></figure> <p class="wp-block-paragraph">And it needs to be as close to 0 as possible:</p> <figure class="wp-block-image size-large"><img decoding="async" src="https://contributor.insightmediagroup.io/wp-content/uploads/2025/04/image-52-1024x638.png" alt="" class="wp-image-601673"/><figcaption class="wp-element-caption">Image made by author </figcaption></figure> <p class="wp-block-paragraph">But the question still stands. Why is this “better” than the simple Black-Scholes? Why not just use the differential equation? Well, because sometimes, in life, solving the differential equation doesn’t guarantee you the “real” solution. Physics is usually approximating things, and it is doing that in a way that could create a difference between what we expect and what we see. That is why the PINN is an amazing and fascinating tool: you try to match the physics, but you are strict in the fact that the results have to match what you “see” from your dataset. </p> <p class="wp-block-paragraph">In our case, it might be that, in order to obtain a risk-free portfolio, we find that the theoretical Black-Scholes model doesn’t fully match the noisy, biased, or imperfect market data we’re observing. Maybe the volatility isn’t constant. Maybe the market isn’t efficient. Maybe the assumptions behind the equation just don’t hold up. That is where an approach like PINN can be helpful. We not only find a solution that meets the Black-Scholes equation, but we also “trust” what we see from the data.</p> <p class="wp-block-paragraph">Ok, enough with the theory. Let’s code. <img src="https://s.w.org/images/core/emoji/15.0.3/72x72/1f468-200d-1f4bb.png" alt="👨💻" class="wp-smiley" style="height: 1em; max-height: 1em;" /></p> <h2 class="wp-block-heading">3. Hands On Python Implementation</h2> <blockquote class="wp-block-quote is-layout-flow wp-block-quote-is-layout-flow"> <p class="wp-block-paragraph">The whole code, with a cool README.md, a fantastic notebook and a super clear modular code, can be found <a href="https://github.com/PieroPaialungaAI/BlackScholesPINN">here</a></p> <p class="wp-block-paragraph">P.S. This will be a little intense (a lot of code), and if you are not into software, feel free to skip to the next chapter. I will show the results in a more friendly way <img src="https://s.w.org/images/core/emoji/15.0.3/72x72/1f642.png" alt="🙂" class="wp-smiley" style="height: 1em; max-height: 1em;" /></p> </blockquote> <p class="wp-block-paragraph">Thank you a lot for getting to this point <img src="https://s.w.org/images/core/emoji/15.0.3/72x72/2764.png" alt="❤" class="wp-smiley" style="height: 1em; max-height: 1em;" /><br>Let’s see how we can implement this. </p> <h3 class="wp-block-heading">3.1 Config.json file</h3> <p class="wp-block-paragraph">The whole code can run with a very simple configuration file, which I called <strong>config.json</strong>.</p> <p class="wp-block-paragraph">You can place it wherever you like, as we will see.</p> <div class="wp-block-tds-gist-embed"> <script src="https://gist.github.com/PieroPaialungaAI/53e4c4f4fc457c4d78a1a200d02da930.js"></script> </div> <p class="wp-block-paragraph">This file is crucial, as it defines all the parameters that govern our simulation, data generation, and model training. Let me quickly walk you through what each value represents:</p> <ul class="wp-block-list"> <li class="wp-block-list-item"><code>K</code>: the <strong>strike price</strong> — this is the price at which the option gives you the right to buy the stock in the future. </li> <li class="wp-block-list-item"><code>T</code>: the <strong>time to maturity</strong>, in years. So <code>T = 1.0</code> means the option expires one unit (for example, one year) from now.</li> <li class="wp-block-list-item"><code>r</code>: the <strong>risk-free interest rate is</strong> used to discount future values. This is the interest rate we are setting in our simulation.</li> <li class="wp-block-list-item"><code>sigma</code>: the <strong>volatility</strong> of the stock, which quantifies how unpredictable or “risky” the stock price is. Again, a simulation parameter.</li> <li class="wp-block-list-item"><code>N_data</code>: the number of <strong>synthetic data points</strong> we want to generate for training. This will condition the size of the model as well.</li> <li class="wp-block-list-item"><code>min_S</code> and <code>max_S</code>: the <strong>range of stock prices</strong> we want to sample when generating synthetic data. Min and max in our stock price.</li> <li class="wp-block-list-item"><code>bias</code>: an optional <strong>offset added to the option prices</strong>, to simulate a systemic shift in the data. This is done to create a discrepancy between the real world and the Black-Scholes data</li> <li class="wp-block-list-item"><code>noise_variance</code>: the <strong>amount of noise</strong> added to the option prices to simulate measurement or market noise. This parameter is add for the same reason as before. </li> <li class="wp-block-list-item"><code>epochs</code>: how many <strong>iterations</strong> the model will train for. </li> <li class="wp-block-list-item"><code>lr</code>: the <strong>learning rate</strong> of the optimizer. This controls how fast the model updates during training.</li> <li class="wp-block-list-item"><code>log_interval</code>: how often (in terms of epochs) we want to <strong>print logs</strong> to monitor training progress.</li> </ul> <p class="wp-block-paragraph">Each of these parameters plays a specific role, some shape the financial world we’re simulating, others control how our neural network interacts with that world. Small tweaks here can lead to very different behavior, which makes this file both powerful and delicate. Changing the values of this JSON file will radically change the output of the code. </p> <h3 class="wp-block-heading">3.2 main.py</h3> <p class="wp-block-paragraph">Now let’s look at how the rest of the code uses this config in practice.</p> <p class="wp-block-paragraph">The main part of our code comes from <strong><em>main.py</em></strong>, train your PINN using Torch, and <strong><em>black_scholes</em>.py</strong>.</p> <p class="wp-block-paragraph">This is main.py:</p> <div class="wp-block-tds-gist-embed"> <script src="https://gist.github.com/PieroPaialungaAI/14dc8c3bbe314216382574442fde37a9.js"></script> </div> <p class="wp-block-paragraph">So what you can do is:</p> <ol class="wp-block-list"> <li class="wp-block-list-item">Build your config.json file </li> <li class="wp-block-list-item">Run <code>python main.py --config config.json</code></li> </ol> <p class="wp-block-paragraph">main.py uses a lot of other files.</p> <h3 class="wp-block-heading">3.3 black_scholes.py and helpers</h3> <p class="wp-block-paragraph">The implementation of the model is inside <strong>black_scholes.py</strong>:</p> <div class="wp-block-tds-gist-embed"> <script src="https://gist.github.com/PieroPaialungaAI/f8bf7da09c50d95c1b8b9ce56fb07307.js"></script> </div> <p class="wp-block-paragraph">This can be used to build the model, train, export, and predict. <br>The function uses some helpers as well, like data.py, loss.py, and model.py. <br>The torch model is inside <strong>model.py</strong>:</p> <div class="wp-block-tds-gist-embed"> <script src="https://gist.github.com/PieroPaialungaAI/469667d1f17ee6a35978f653b9cd007f.js"></script> </div> <p class="wp-block-paragraph">The data builder (given the config file) is inside <strong>data</strong><em><strong>.</strong></em><strong>py</strong>:</p> <div class="wp-block-tds-gist-embed"> <script src="https://gist.github.com/PieroPaialungaAI/785655bc73b8d82773b0fbbd3f3d7680.js"></script> </div> <p class="wp-block-paragraph">And the beautiful loss function that incorporates the value of is <strong>loss.py</strong></p> <div class="wp-block-tds-gist-embed"> <script src="https://gist.github.com/PieroPaialungaAI/15dc3747c9a0de02913b562b26e4c961.js"></script> </div> <h3 class="wp-block-heading">4. Results</h3> <p class="wp-block-paragraph">Ok, so if we run main.py, our FFNN gets trained, and we get this.</p> <figure class="wp-block-image aligncenter size-large"><img decoding="async" src="https://contributor.insightmediagroup.io/wp-content/uploads/2025/04/Screenshot-2025-04-16-at-6.40.02-PM-1024x201.png" alt="" class="wp-image-601676"/><figcaption class="wp-element-caption">Image made by author</figcaption></figure> <p class="wp-block-paragraph">As you notice, the model error is not quite 0, but the PDE of the model is much smaller than the data. That means that the model is (naturally) aggressively forcing our predictions to meet the differential equations. This is exactly what we said before: we optimize both in terms of the data that we have and in terms of the Black-Scholes model. </p> <p class="wp-block-paragraph">We can notice, qualitatively, that there is a great match between the noisy + biased real-world (rather realistic-world lol) dataset and the PINN. </p> <figure class="wp-block-image size-full"><img decoding="async" src="https://contributor.insightmediagroup.io/wp-content/uploads/2025/04/image-53.png" alt="" class="wp-image-601677"/><figcaption class="wp-element-caption">Image made by author</figcaption></figure> <p class="wp-block-paragraph">These are the results when t = 0, and the Stock price changes with the Call Option at a fixed t. Pretty cool, right? But it’s not over! You can explore the results using the code above in two ways:</p> <ol class="wp-block-list"> <li class="wp-block-list-item">Playing with the multitude of <strong>parameters</strong> that you have in config.json</li> <li class="wp-block-list-item">Seeing the predictions at <strong>t>0</strong></li> </ol> <p class="wp-block-paragraph">Have fun! <img src="https://s.w.org/images/core/emoji/15.0.3/72x72/1f642.png" alt="🙂" class="wp-smiley" style="height: 1em; max-height: 1em;" /> </p> <h3 class="wp-block-heading">5. Conclusions</h3> <p class="wp-block-paragraph">Thank you so much for making it all the way through. Seriously, this was a long one <img src="https://s.w.org/images/core/emoji/15.0.3/72x72/1f605.png" alt="😅" class="wp-smiley" style="height: 1em; max-height: 1em;" /><br>Here’s what you’ve seen in this article:</p> <ol class="wp-block-list"> <li class="wp-block-list-item"><strong>We started with Physics</strong>, and how its rules, written as differential equations, are fair, beautiful, and (usually) predictable.</li> <li class="wp-block-list-item"><strong>We jumped into Finance</strong>, and met the Black-Scholes model — a differential equation that aims to price options in a risk-free way.</li> <li class="wp-block-list-item"><strong>We explored Physics-Informed Neural Networks (PINNs)</strong>, a type of neural network that doesn’t just fit data but respects the underlying differential equation.</li> <li class="wp-block-list-item"><strong>We implemented everything in Python</strong>, using PyTorch and a clean, modular codebase that lets you tweak parameters, generate synthetic data, and train your own PINNs to solve Black-Scholes.</li> <li class="wp-block-list-item"><strong>We visualized the results</strong> and saw how the network learned to match not only the noisy data but also the behavior expected by the Black-Scholes equation.</li> </ol> <p class="wp-block-paragraph">Now, I know that digesting all of this at once is not easy. In some areas, I was necessarily short, maybe shorter than I needed to be. Nonetheless, if you want to see things in a clearer way, again, give a look at the <a href="https://github.com/PieroPaialungaAI/BlackScholesPINN/tree/main">GitHub folder.</a> Even if you are not into software, there is a clear README.md and a simple <strong>example/BlackScholesModel.ipynb </strong>that explains the project step by step.</p> <h3 class="wp-block-heading">6. About me!</h3> <p class="wp-block-paragraph">Thank you again for your time. It means a lot <img src="https://s.w.org/images/core/emoji/15.0.3/72x72/2764.png" alt="❤" class="wp-smiley" style="height: 1em; max-height: 1em;" /></p> <p class="wp-block-paragraph">My name is Piero Paialunga, and I’m this guy here:</p> <figure class="wp-block-image"><img data-dominant-color="a6a1a0" data-has-transparency="true" style="--dominant-color: #a6a1a0;" fetchpriority="high" decoding="async" width="1024" height="1024" src="https://towardsdatascience.com/wp-content/uploads/2025/02/0_w9Y8ftqBkR5kNWR5-1024x1024.png" alt="" class="wp-image-597454 has-transparency" srcset="https://towardsdatascience.com/wp-content/uploads/2025/02/0_w9Y8ftqBkR5kNWR5-1024x1024.png 1024w, https://towardsdatascience.com/wp-content/uploads/2025/02/0_w9Y8ftqBkR5kNWR5-300x300.png 300w, https://towardsdatascience.com/wp-content/uploads/2025/02/0_w9Y8ftqBkR5kNWR5-150x150.png 150w, https://towardsdatascience.com/wp-content/uploads/2025/02/0_w9Y8ftqBkR5kNWR5-768x768.png 768w, https://towardsdatascience.com/wp-content/uploads/2025/02/0_w9Y8ftqBkR5kNWR5.png 1080w" sizes="(max-width: 1024px) 100vw, 1024px" /></figure> <p class="wp-block-paragraph">I am a Ph.D. candidate at the University of Cincinnati Aerospace Engineering Department. I talk about AI, and <a href="https://towardsdatascience.com/tag/machine-learning/" title="Machine Learning">Machine Learning</a> in my blog posts and on LinkedIn and here on TDS. If you liked the article and want to know more about machine learning and follow my studies you can:</p> <p class="wp-block-paragraph">A. Follow me on <a href="https://www.linkedin.com/in/pieropaialunga/" target="_blank" rel="noreferrer noopener"><strong>Linkedin</strong></a>, where I publish all my stories<br>B. Follow me on <a href="https://github.com/PieroPaialungaAI"><strong>GitHub</strong></a>, where you can see all my code<br>C. Send me an email: <em><strong>piero.paialunga@hotmail.com</strong></em><br>D. Want to work with me? Check my rates and projects on <a href="https://www.upwork.com/freelancers/~017f9a75d13c030610" target="_blank" rel="noreferrer noopener"><strong>Upwork</strong></a>!<br></p> <p class="wp-block-paragraph">Ciao. <img src="https://s.w.org/images/core/emoji/15.0.3/72x72/2764.png" alt="❤" class="wp-smiley" style="height: 1em; max-height: 1em;" /></p> <blockquote class="wp-block-quote is-layout-flow wp-block-quote-is-layout-flow"> <p class="wp-block-paragraph">P.S. My PhD is ending and I’m considering my next step for my career! If you like how I work and you want to hire me, don’t hesitate to reach out. <img src="https://s.w.org/images/core/emoji/15.0.3/72x72/1f642.png" alt="🙂" class="wp-smiley" style="height: 1em; max-height: 1em;" /> </p> </blockquote> <p>The post <a href="https://towardsdatascience.com/when-physics-meets-finance-using-ai-to-solve-black-scholes/">When Physics Meets Finance: Using AI to Solve Black-Scholes</a> appeared first on <a href="https://towardsdatascience.com">Towards Data Science</a>.</p>Google’s New AI System Outperforms Physicians in Complex Diagnoses
Thu, 17 Apr 2025 20:04:05 -0000
Published in Nature, Google's new paper advances the future of AI-powered medicine: more automated thus reducing costs and relieving doctors' load so they can attend harder cases
The post Google’s New AI System Outperforms Physicians in Complex Diagnoses appeared first on Towards Data Science.
<p class="wp-block-paragraph"><mdspan datatext="el1744868302944" class="mdspan-comment">Imagine</mdspan> going to the doctor with a baffling set of symptoms. Getting the right diagnosis quickly is crucial, but sometimes even experienced physicians face challenges piecing together the puzzle. Sometimes it might not be something serious at all; others a deep investigation might be required. No wonder AI systems are making progress here, as we have already seen them assisting increasingly more and more on tasks that require thinking over documented patterns. But Google just seems to have taken a very strong leap in the direction of making “AI doctors” actually happen.</p> <p class="wp-block-paragraph">AI’s “intromission” into medicine isn’t entirely new; algorithms (including many AI-based ones) have been aiding clinicians and researchers in tasks such as image analysis for years. We more recently saw anecdotal and also some documented evidence that AI systems, particularly Large Language Models (LLMs), can assist doctors in their diagnoses, with some claims of nearly similar accuracy. But in this case it is all different, because the new work from Google Research introduced an LLM specifically trained on datasets relating observations with diagnoses. While this is only a starting point and many challenges and considerations lie ahead as I will discuss, the fact is clear: a powerful new AI-powered player is entering the arena of medical diagnosis, and we better get prepared for it. In this article I will mainly focus on how this new system works, calling out along the way various considerations that arise, some discussed in Google’s paper in Nature and others debated in the relevant communities — i.e. medical doctors, insurance companies, policy makers, etc.</p> <h2 class="wp-block-heading">Meet Google’s New Superb AI System for Medical Diagnosis</h2> <p class="wp-block-paragraph">The advent of sophisticated LLMs, which as you surely know are AI systems trained on vast datasets to “understand” and generate human-like text, is representing a substantial upshift of gears in how we process, analyze, condense, and generate information (at the end of this article I posted some other articles related to all that — go check them out!). The latest models in particular bring a new capability: engaging in nuanced, text-based reasoning and conversation, making them potential partners in complex cognitive tasks like diagnosis. In fact, the new work from Google that I discuss here is “just” one more point in a rapidly growing field exploring how these advanced AI tools can understand and contribute to clinical workflows.</p> <p class="wp-block-paragraph">The study we are looking into here was published in peer-reviewed form in the prestigious journal <em>Nature</em>, sending ripples through the medical community. In their article “Towards accurate differential diagnosis with large language models” Google Research presents a specialized type of LLM called AMIE after <em>Articulate Medical Intelligence Explorer</em>, trained specifically with clinical data with the goal of assisting medical diagnosis or even running fully autonomically. The authors of the study tested AMIE’s ability to generate a list of possible diagnoses — what doctors call a “differential diagnosis” — for hundreds of complex, real-world medical cases published as challenging case reports.</p> <p class="wp-block-paragraph">Here’s the paper with full technical details:</p> <p class="wp-block-paragraph"><a href="https://www.nature.com/articles/s41586-025-08869-4">https://www.nature.com/articles/s41586-025-08869-4</a></p> <h2 class="wp-block-heading">The Surprising Results</h2> <p class="wp-block-paragraph">The findings were striking. When AMIE worked alone, just analyzing the text of the case reports, its diagnostic accuracy was significantly higher than that of experienced physicians working without assistance! AMIE included the correct diagnosis in its top-10 list almost 60% of the time, compared to about 34% for the unassisted doctors.</p> <p class="wp-block-paragraph">Very intriguingly, and in favor of the AI system, AMIE alone slightly outperformed doctors who were assisted by AMIE itself! While doctors using AMIE improved their accuracy significantly compared to using standard tools like Google searches (reaching over 51% accuracy), the AI on its own still edged them out slightly on this specific metric for these challenging cases.</p> <p class="wp-block-paragraph">Another “point of awe” I find is that in this study comparing AMIE to human experts, the AI system only analyzed the text-based descriptions from the case reports used to test it. However, the human clinicians had access to the full reports, that is the same text descriptions available to AMIE plus images (like X-rays or pathology slides) and tables (like lab results). The fact that AMIE outperformed unassisted clinicians even without this multimodal information is on one side remarkable, and on another side underscores an obvious area for future development: integrating and reasoning over multiple data types (text, imaging, possibly also raw genomics and sensor data) is a key frontier for medical AI to truly mirror comprehensive clinical assessment.</p> <h2 class="wp-block-heading">AMIE as a Super-Specialized LLM</h2> <p class="wp-block-paragraph">So, how does an AI like AMIE achieve such impressive results, performing better than human experts some of whom might have years diagnosing diseases?</p> <p class="wp-block-paragraph">At its core, AMIE builds upon the foundational technology of LLMs, similar to models like GPT-4 or Google’s own Gemini. However, AMIE isn’t just a general-purpose chatbot with medical knowledge layered on top. It was specifically optimized for clinical diagnostic reasoning. As described in more detail in the Nature paper, this involved:</p> <ul class="wp-block-list"> <li class="wp-block-list-item"><strong>Specialized training data:</strong> Fine-tuning the base LLM on a massive corpus of medical literature that includes diagnoses.</li> <li class="wp-block-list-item"><strong>Instruction tuning:</strong> Training the model to follow specific instructions related to generating differential diagnoses, explaining its reasoning, and interacting helpfully within a clinical context.</li> <li class="wp-block-list-item"><strong>Reinforcement Learning from Human Feedback:</strong> Potentially using feedback from clinicians to further refine the model’s responses for accuracy, safety, and helpfulness.</li> <li class="wp-block-list-item"><strong>Reasoning Enhancement:</strong> Techniques designed to improve the model’s ability to logically connect symptoms, history, and potential conditions; similar to those used during the reasoning steps in very powerful models such as Google’s own Gemini 2.5 Pro!</li> </ul> <p class="wp-block-paragraph">Note that the paper itself indicates that AMIE outperformed GPT-4 on automated evaluations for this task, highlighting the benefits of domain-specific optimization. Notably too, but negatively, the paper does not compare AMIE’s performance against other general LLMs, not even Google’s own “smart” models like Gemini 2.5 Pro. That’s quite disappointing, and I can’t understand how the reviewers of this paper overlooked this!</p> <p class="wp-block-paragraph">Importantly, AMIE’s implementation is designed to support interactive usage, so that clinicians could ask it questions to probe its reasoning — a key difference from regular diagnostic systems.</p> <h3 class="wp-block-heading">Measuring Performance</h3> <p class="wp-block-paragraph">Measuring performance and accuracy in the produced diagnoses isn’t trivial, and is interesting for you reader with a <a href="https://towardsdatascience.com/tag/data-science/" title="Data Science">Data Science</a> mindset. In their work, the researchers didn’t just assess AMIE in isolation; rather they employed a randomized controlled setup whereby AMIE was compared against unassisted clinicians, clinicians assisted by standard search tools (like Google, PubMed, etc.), and clinicians assisted by AMIE itself (who could also use search tools, though they did so less often).</p> <p class="wp-block-paragraph">The analysis of the data produced in the study involved multiple metrics beyond simple accuracy, most notably the top-n accuracy (which asks: was the correct diagnosis in the top 1, 3, 5, or 10?), quality scores (how close was the list to the final diagnosis?), appropriateness, and comprehensiveness — the latter two rated by independent specialist physicians blinded to the source of the diagnostic lists.</p> <p class="wp-block-paragraph">This wide evaluation provides a more robust picture than a single accuracy number; and the comparison against both unassisted performance and standard tools helps quantify the actual added value of the AI.</p> <h2 class="wp-block-heading">Why Does AI Do so Well at Diagnosis?</h2> <p class="wp-block-paragraph">Like other specialized medical AIs, AMIE was trained on vast amounts of medical literature, case studies, and clinical data. These systems can process complex information, identify patterns, and recall obscure conditions far faster and more comprehensively than a human brain juggling countless other tasks. AMIE, in particualr, was specifically optimized for the kind of reasoning doctors use when diagnosing, akin to other reasoning models but in this cases specialized for gianosis.</p> <p class="wp-block-paragraph">For the particularly tough “diagnostic puzzles” used in the study (sourced from the prestigious <em>New England Journal of Medicine</em>), AMIE’s ability to sift through possibilities without human biases might give it an edge. As an observer noted in the vast discussion that this paper triggered over social media, it is impressive that AI excelled not just on simple cases, but also on some quite challenging ones.</p> <h3 class="wp-block-heading">AI Alone vs. AI + Doctor</h3> <p class="wp-block-paragraph">The finding that AMIE alone slightly outperformed the AMIE-assisted human experts is puzzling. Logically, adding a skilled doctor’s judgment to a powerful AI should yield the best results (as previous studies with have shown, in fact). And indeed, doctors with AMIE did significantly better than doctors without it, producing more comprehensive and accurate diagnostic lists. But AMIE alone worked slightly better than doctors assisted by it.</p> <p class="wp-block-paragraph">Why the slight edge for AI alone in this study? As highlighted by some medical experts over social media, this small difference probably doesn’t mean that doctors make the AI worse or the other way around. Instead, it probably suggests that, not being familiar with the system, the doctors haven’t yet figured out the best way to collaborate with AI systems that possess more raw analytical power than humans for specific tasks and goals. This, just like we might not be interacting perfecly with a regular LLM when we need its help.</p> <p class="wp-block-paragraph">Again paralleling very well how we interact with regular LLMs, it might well be that doctors initially stick too closely to their own ideas (an “anchoring bias”) or that they do not know how to best “interrogate” the AI to get the most useful insights. It’s all a new kind of teamwork we need to learn — human with machine.</p> <p class="wp-block-paragraph"><strong>Hold On — Is AI Replacing Doctors Tomorrow?</strong><br>Absolutely not, of course. And it is crucial to understand the limitations:</p> <ul class="wp-block-list"> <li class="wp-block-list-item"><strong>Diagnostic “puzzles” vs. real patients:</strong> The study presenting AMIE used written case reports, that is condensed, pre-packaged information, very different from the raw inputs that doctors have during their interactions with patients. Real medicine involves talking to patients, understanding their history, performing physical exams, interpreting non-verbal cues, building trust, and managing ongoing care — things AI cannot do, at least yet. Medicine even involves human connection, empathy, and navigating uncertainty, not just processing data. Think for example of placebo effects, ghost pain, physical tests, etc.</li> <li class="wp-block-list-item"><strong>AI isn’t perfect:</strong> LLMs can still make mistakes or “hallucinate” information, a major problem. So even if AMIE were to be deployed (which it won’t!), it would need very close oversight from skilled professionals.</li> <li class="wp-block-list-item"><strong>This is just one specific task:</strong> Generating a diagnostic list is just one part of a doctor’s job, and the rest of the visit to a doctor of course has many other components and stages, none of them handled by such a specialized system and potentially very difficult to achieve, for the reasons discussed.</li> </ul> <h2 class="wp-block-heading">Back-to-Back: Towards conversational diagnostic artificial intelligence</h2> <p class="wp-block-paragraph">Even more surprisingly, in the same issue of <em>Nature and </em>following the article on AMIE, Google Research published another paper showing that in diagnostic conversations (that is not just the analysis of symptoms but actual dialogue between the patient and the doctor or AMIE) the model ALSO outperforms physicians! Thus, somehow, while the former paper found an objectively better diagnosis by AMIE, the second paper shows a better communication of the results with the patient (in terms of quality and empathy) by the AI system!</p> <p class="wp-block-paragraph">And the results aren’t by a small margin: In 159 simulated cases, specialist physicians rated the AI superior to primary care physicians on 30 out of 32 metrics, while test patients preferred the AMIE on 25 of 26 measures.</p> <p class="wp-block-paragraph">This second paper is here:</p> <p class="wp-block-paragraph"><a href="https://www.nature.com/articles/s41586-025-08866-7">https://www.nature.com/articles/s41586-025-08866-7</a></p> <p class="wp-block-paragraph"><strong>Seriously: Medical Associations Need to Pay Attention NOW</strong></p> <p class="wp-block-paragraph">Despite the many limitations, this study and others like it are a loud call. Specialized AI is rapidly evolving and demonstrating capabilities that can augment, and in some narrow tasks, even surpass human experts.</p> <p class="wp-block-paragraph">Medical associations, licensing boards, educational institutions, policy makers, insurances, and why not everybody in this world that might potentially be the subject of an AI-based health investigation, need to get acquainted with this, and the topic mist be place high on the agenda of governments.</p> <p class="wp-block-paragraph">AI tools like AMIE and future ones could help doctors diagnose complex conditions faster and more accurately, potentially improving patient outcomes, especially in areas lacking specialist expertise. It might also help to quickly diagnose and dismiss healthy or low-risk patients, reducing the burden for doctors who must evaluate more serious cases. Of course all this could improve the chances of solving health issues for patients with more complex problems, at the same time as it lowers costs and waiting times.</p> <p class="wp-block-paragraph">Like in many other fields, the role of the physician will evolve, sooner or later thanks to AI. Perhaps AI could handle more initial diagnostic heavy lifting, freeing up doctors for patient interaction, complex decision-making, and treatment planning — potentially also easing burnout from excessive paperwork and rushed appointments, as some hope. As someone noted on social media discussions of this paper, not every doctor finds it pleasnt to meet 4 or more patients an hour and doing all the associated paperwork.</p> <p class="wp-block-paragraph">In order to move forward with the inminent application of systems like AMIE, we need guidelines. How should these tools be integrated safely and ethically? How do we ensure patient safety and avoid over-reliance? Who is responsible when an AI-assisted diagnosis is wrong? Nobody has clear, consensual answers to these questions yet.</p> <p class="wp-block-paragraph">Of course, then, doctors need to be trained on how to use these tools effectively, understanding their strengths and weaknesses, and learning what will essentially be a new form of human-AI collaboration. This development will have to happen with medical professionals on board, not by imposing it to them.</p> <p class="wp-block-paragraph">Last, as it always comes back to the table: how do we ensure these powerful tools don’t worsen existing health disparities but instead help bridge gaps in access to expertise?</p> <h3 class="wp-block-heading">Conclusion</h3> <p class="wp-block-paragraph">The goal isn’t to replace doctors but to empower them. Clearly, AI systems like AMIE offer incredible potential as highly knowledgeable assistants, in everyday medicine and especially in complex settings such as in areas of disaster, during pandemics, or in remote and isolated places such as overseas ships and space ships or extraterrestrial colonies. But realizing that potential safely and effectively requires the medical community to engage proactively, critically, and urgently with this rapidly advancing technology. The future of diagnosis is likely AI-collaborative, so we need to start figuring out the rules of engagement today.</p> <h3 class="wp-block-heading">References</h3> <p class="wp-block-paragraph">The article presenting AMIE:</p> <p class="wp-block-paragraph"><a href="https://www.nature.com/articles/s41586-025-08869-4">Towards accurate differential diagnosis with large language models</a></p> <p class="wp-block-paragraph">And here the results of AMIE evaluation by test patients:</p> <p class="wp-block-paragraph"><a href="https://www.nature.com/articles/s41586-025-08866-7">Towards conversational diagnostic artificial intelligence</a></p> <h3 class="wp-block-heading">And here some other posts of mine that you might enjoy</h3> <figure class="wp-block-embed is-type-wp-embed is-provider-towards-data-science wp-block-embed-towards-data-science"><div class="wp-block-embed__wrapper"> <blockquote class="wp-embedded-content" data-secret="dHOKKFPLIw"><a href="https://towardsdatascience.com/testing-the-power-of-multimodal-ai-systems-in-reading-and-interpreting-photographs-maps-charts-and-more/">Testing the Power of Multimodal AI Systems in Reading and Interpreting Photographs, Maps, Charts and More</a></blockquote><iframe class="wp-embedded-content" sandbox="allow-scripts" security="restricted" title="“Testing the Power of Multimodal AI Systems in Reading and Interpreting Photographs, Maps, Charts and More” — Towards Data Science" src="https://towardsdatascience.com/testing-the-power-of-multimodal-ai-systems-in-reading-and-interpreting-photographs-maps-charts-and-more/embed/#?secret=fUgPJz95RA#?secret=dHOKKFPLIw" data-secret="dHOKKFPLIw" width="500" height="282" frameborder="0" marginwidth="0" marginheight="0" scrolling="no"></iframe> </div></figure> <ul class="wp-block-list"> <li class="wp-block-list-item"><a href="https://pub.towardsai.net/provocatively-microsoft-researchers-say-they-found-sparks-of-artificial-intelligence-in-gpt-4-e1120f8bd058">Provocatively, Microsoft Researchers Say They Found “Sparks of Artificial Intelligence” in GPT-4</a></li> </ul> <ul class="wp-block-list"> <li class="wp-block-list-item"><a href="https://medium.com/data-science/sparks-of-chemical-intuition-and-gross-limitations-in-alphafold-3-8487ba4dfb53">“Sparks of Chemical Intuition”—and Gross Limitations!—in AlphaFold 3</a></li> </ul> <ul class="wp-block-list"> <li class="wp-block-list-item"><a href="https://medium.com/data-science/exploring-data-analysis-via-natural-language-approach-1-224965d1fb16">Exploring Data Analysis Via Natural Language Using LLMs — Approach 1</a></li> </ul> <ul class="wp-block-list"> <li class="wp-block-list-item"><a href="https://medium.com/data-science/powerful-data-analysis-and-plotting-via-natural-language-requests-by-giving-llms-access-to-9d34841c2a5d">Powerful Data Analysis and Plotting via Natural Language Requests by Giving LLMs Access to Libraries</a></li> </ul> <p>The post <a href="https://towardsdatascience.com/googles-new-ai-system-outperforms-physicians-in-complex-diagnoses/">Google’s New AI System Outperforms Physicians in Complex Diagnoses</a> appeared first on <a href="https://towardsdatascience.com">Towards Data Science</a>.</p>The Good-Enough Truth
Thu, 17 Apr 2025 19:22:53 -0000
Lies, damned lies, and LLMs
The post The Good-Enough Truth appeared first on Towards Data Science.
<p class="wp-block-paragraph" id="9702">Could <a href="https://www.forbes.com/sites/quickerbettertech/2025/04/13/business-tech-news-shopify-ceo-says-ai-first-before-employees/" target="_blank" rel="noreferrer noopener">Shopify be right</a> in requiring teams to demonstrate why AI can’t do a job before approving new human hires? Will companies that prioritize AI solutions eventually evolve into AI entities with significantly fewer employees?</p> <p class="wp-block-paragraph" id="a656">These are open-ended questions that have puzzled me about where such transformations might leave us in our quest for <a href="https://towardsdatascience.com/tag/knowledge/" title="Knowledge">Knowledge</a> and ‘truth’ itself.</p> <h3 class="wp-block-heading">“<mdspan datatext="el1744868630743" class="mdspan-comment">Knowledge</mdspan> is so frail!”</h3> <p class="wp-block-paragraph">It’s still fresh in my memory: <br>A hot summer day, large classroom windows with burgundy frames that faced south, and Tuesday’s Latin class marathon when our professor turned around and quoted a famous Croatian poet who wrote a poem called “<a href="https://sites.google.com/site/projectgoethe/welcome/dobri%C5%A1a-cesari%C4%87/povratak#h.gl642d6aialk" rel="noreferrer noopener" target="_blank">The Return</a>.”</p> <blockquote class="wp-block-quote is-layout-flow wp-block-quote-is-layout-flow"> <p class="wp-block-paragraph">Who knows (ah, no one, no one knows anything.<br><strong>Knowledge is so frail!</strong>)<br>Perhaps a ray of truth fell on me,<br>Or perhaps I was dreaming.</p> </blockquote> <p class="wp-block-paragraph">He was evidently upset with my class because we forgot the proverb he loved so much and didn’t learn the <a href="https://pressbooks.bccampus.ca/greeklatinroots/chapter/12-latin-nouns-second-declension/#:~:text=The%202nd%20declension%20is%20subdivided,final%20%2Dus%20or%20%2Dum." target="_blank" rel="noreferrer noopener">2nd declension</a> properly. Hence, he found a convenient opportunity to quote the love poem filled with the “<em><a href="https://en.wikipedia.org/wiki/I_know_that_I_know_nothing" target="_blank" rel="noreferrer noopener">scio me nihil scire</a></em>” message and thoughts on life after death in front of a full class of sleepy and uninterested students.</p> <p class="wp-block-paragraph">Ah, well. The teenage rebel in us decided back then that we didn’t want to learn the “dead language” properly because there was no beauty in it. (What a mistake this was!)</p> <blockquote class="wp-block-quote is-layout-flow wp-block-quote-is-layout-flow"> <p class="wp-block-paragraph">But so much truth in this small passage — “<em>knowledge is so frail</em>” — that was a favourite quote of my professor.</p> </blockquote> <p class="wp-block-paragraph">No one is exempt from this, and science itself especially understands how frail knowledge is. It’s contradictory, messy, and flawed; one paper and finding dispute another, experiments can’t be repeated, and it’s full of “politics” and “ranks” that pull the focus from discovery to prestige.</p> <p class="wp-block-paragraph">And yet, within this inherent messiness, we see an iterative process that continuously refines what we accept as “truth,” acknowledging that scientific knowledge is always open to revision.</p> <p class="wp-block-paragraph">Because of this, science is indisputably beautiful, and as it <a href="https://en.wikipedia.org/wiki/Planck%27s_principle#:~:text=Science%20progresses%20one%20funeral%20at%20a%20time" rel="noreferrer noopener" target="_blank">progresses one funeral at a time</a>, it gets firmer in its beliefs. We could now go deep into theory and discuss why this is happening, but then we would question everything science ever did and how it did it.</p> <p class="wp-block-paragraph">On the contrary, it would be more effective to establish a better relationship with “not knowing” and patch our knowledge holes that span back to fundamentals. (From Latin to Math.)</p> <p class="wp-block-paragraph">Because the difference between the people who are <a href="https://www.youtube.com/watch?v=Rsw3eWijBw4" rel="noreferrer noopener" target="_blank">very good at what they do and the very best ones</a> is:</p> <blockquote class="wp-block-quote is-layout-flow wp-block-quote-is-layout-flow"> <p class="wp-block-paragraph">“The very best in any field are not the best because of the flashy advanced things they can do, <strong>rather they tend to be the best because of mastery of the fundamentals.”</strong></p> </blockquote> <h3 class="wp-block-heading">Behold, frail knowledge, the era of LLMs is here</h3> <p class="wp-block-paragraph">Welcome to the era where LinkedIn will probably have more job roles with an “AI<em> </em>[insert_text]” <a href="https://www.linkedin.com/pulse/50-linkedin-statistics-every-professional-should-ti9ue/#:~:text=Hoffman%20in%202003.-,%22Founder%22,-is%20the%20most" target="_blank" rel="noreferrer noopener">than a “Founder” label</a> and employees of the month that are AI agents.</p> <p class="wp-block-paragraph">The fabulous era of LLMs, filled with unlimited knowledge and clues on how the same stands frail as before:</p> <figure class="wp-block-image"><img decoding="async" src="https://contributor.insightmediagroup.io/wp-content/uploads/2025/04/1a9gNaPsM_kTlxk92hSspYg.png" alt="" class="wp-image-601666"/></figure> <figure class="wp-block-image"><img decoding="async" src="https://contributor.insightmediagroup.io/wp-content/uploads/2025/04/1IIcrSRcLsgCry4Kc8Id6QQ.png" alt="" class="wp-image-601667"/></figure> <figure class="wp-block-image"><img decoding="async" src="https://contributor.insightmediagroup.io/wp-content/uploads/2025/04/1YB1uDqRi0r7V1dIGTCjvJw.png" alt="" class="wp-image-601668"/></figure> <p class="wp-block-paragraph">And simply:</p> <figure class="wp-block-image"><img decoding="async" src="https://contributor.insightmediagroup.io/wp-content/uploads/2025/04/1clrDMbxCLQL8hy8tn7_iFA.png" alt="" class="wp-image-601665"/></figure> <p class="wp-block-paragraph">Cherry on top: it’s on you to figure this out and <em>test</em> the outcomes or bear the consequences for not.</p> <p class="wp-block-paragraph">“Testing”, proclaimed the believer, “that is part of the process.”</p> <p class="wp-block-paragraph">How could we ever forget <em>the process</em>? The “concept” that gets invoked whenever we need to obscure the truth: that we’re trading one type of labour for another, often without understanding the exchange rate.</p> <p class="wp-block-paragraph">The irony is exquisite.</p> <p class="wp-block-paragraph">We built LLMs to help us know or do more things so we can focus on “what’s important.” However, we now find ourselves facing the challenge of constantly identifying whether what they tell us is true, which prevents us from focusing on what we should be doing. (Getting the knowledge!)</p> <p class="wp-block-paragraph">No strings attached; for an average of $20 per month, cancellation is possible at any time, and your most arcane questions will be answered with the confidence of a professor emeritus in one firm sentence: “<em>Sure, I can do that.</em>”</p> <p class="wp-block-paragraph">Sure, it can…and then delivers complete hallucinations within seconds.</p> <p class="wp-block-paragraph">You could argue now that the price is worth it, and if you spend 100–200x this on someone’s salary, you still get the same output, which is not an acceptable cost.</p> <p class="wp-block-paragraph">Glory be the trade-off between technology and cost that was passionately battling on-premise vs. cloud costs before, and now additionally battles human vs. AI labour costs, all in the name of generating “the business value.”</p> <p class="wp-block-paragraph">“<a href="https://www.cnbc.com/2025/04/07/shopify-ceo-prove-ai-cant-do-jobs-before-asking-for-more-headcount.html#:~:text=cannot%20get%20what%20they%20want%20done%20using%20AI" rel="noreferrer noopener" target="_blank">Teams must demonstrate why they cannot get what they want done using AI</a>,” possibly to people who did similar work on the abstraction level. (But you will have a <em>process</em> to prove this!)</p> <p class="wp-block-paragraph">Of course, this is if you think that the cutting edge of technology can be purely responsible for generating the business value without the people behind it.</p> <blockquote class="wp-block-quote is-layout-flow wp-block-quote-is-layout-flow"> <p class="wp-block-paragraph">Think twice, because this cutting edge of technology is nothing more than a <em>tool</em>. A <em>tool</em> that can’t understand. A <em>tool</em> that needs to be maintained and secured.</p> </blockquote> <p class="wp-block-paragraph">A <em>tool</em> that people who already <em>knew</em> what they were doing, and were very skilled at this, are now using to some extent to make specific tasks less daunting.</p> <p class="wp-block-paragraph">A <em>tool</em> that assists them to come from point A to point B in a more performant way, while still taking ownership over what’s important — the full development logic and decision making.</p> <p class="wp-block-paragraph">Because they <em>understand</em> how to do things and what the <em>goal,</em> which should be fixed in <em>focus, </em>is.</p> <blockquote class="wp-block-quote is-layout-flow wp-block-quote-is-layout-flow"> <p class="wp-block-paragraph">And knowing and understanding are not the same thing, and they don’t yield the same results.</p> </blockquote> <p class="wp-block-paragraph">“But look at how much [insert_text] we’re producing,” proclaimed the believer again, mistaking <em>volume</em> for <em>value, output</em> for <em>outcome, </em>and<em> lies </em>for<em> truth.</em></p> <p class="wp-block-paragraph">All because of frail knowledge.</p> <h3 class="wp-block-heading">“The good enough” truth</h3> <p class="wp-block-paragraph">To paraphrase <a href="https://en.wikipedia.org/wiki/Sheldon_Cooper" rel="noreferrer noopener" target="_blank">Sheldon Cooper</a> from one of my <a href="https://bigbangtheory.fandom.com/wiki/The_Closet_Reconfiguration" rel="noreferrer noopener" target="_blank">favourite Big Bang Theory episodes:</a></p> <blockquote class="wp-block-quote is-layout-flow wp-block-quote-is-layout-flow"> <p class="wp-block-paragraph">“It occurred to me that knowing and not knowing can be achieved by creating a macroscopic example of <strong><a href="https://en.wikipedia.org/wiki/Quantum_superposition" target="_blank" rel="noreferrer noopener">quantum superposition</a>.</strong><br>…<br>If you get presented with multiple stories, only one of which is true, and you don’t know which one it is, you will forever be in <a href="https://medicalexecutivepost.com/tag/epistemic-ambivalence/" target="_blank" rel="noreferrer noopener"><strong>a state of epistemic ambivalence</strong></a><strong>.</strong>”</p> </blockquote> <p class="wp-block-paragraph">The “truth” now has multiple versions, but we are not always (or straightforwardly) able to determine which (if any) is correct without putting in precisely the mental effort we were trying to avoid in the first place.</p> <p class="wp-block-paragraph">These large models, trained on almost collective digital output of humanity, simultaneously know everything and nothing. They are probability machines, and when we interact with them, we’re not accessing the “truth” but engaging with a sophisticated statistical approximation of human knowledge. (Behold the knowledge gap; you won’t get closed!)</p> <p class="wp-block-paragraph">Human knowledge is frail itself; it comes with all our collective uncertainties, assumptions, biases, and gaps.</p> <blockquote class="wp-block-quote is-layout-flow wp-block-quote-is-layout-flow"> <p class="wp-block-paragraph">We know how we don’t know, so we rely on the tools that “assure us” they know how they know, with open disclaimers of how they don’t know.</p> </blockquote> <p class="wp-block-paragraph">This is our interesting new world: confident incorrectness at scale, democratized hallucination, and the industrialisation of the “<em>good enough</em>” truth.</p> <p class="wp-block-paragraph">“<em>Good enough</em>,” we say as we skim the AI-generated report without checking its references. <br>“<em>Good enough,</em>” we mutter as we implement the code snippet without fully understanding its logic. <br>“<em>Good enough</em>,” we reassure ourselves as we build businesses atop foundations of statistical hallucinations.<br>(At least we demonstrated that AI can do it!)</p> <p class="wp-block-paragraph">“<em>Good enough</em>” truth heading bold towards becoming the standard that follows lies and damned lies backed up with processes and a starting price tag of $20 per month — pointing out that knowledge gaps will never be patched, and echoing a favourite poem passage from my Latin professor:</p> <blockquote class="wp-block-quote is-layout-flow wp-block-quote-is-layout-flow"> <p class="wp-block-paragraph"><strong>“Ah, no one, no one knows anything. Knowledge is so frail!”</strong></p> </blockquote> <hr class="wp-block-separator has-alpha-channel-opacity is-style-dotted" datatext=""/> <p class="wp-block-paragraph">This post was originally published on <a data-type="link" data-id="https://ai.gopubby.com/the-good-enough-truth-c7cb2e633799" href="https://ai.gopubby.com/the-good-enough-truth-c7cb2e633799">Medium in the AI Advances</a> publication.</p> <hr class="wp-block-separator has-alpha-channel-opacity is-style-dotted" datatext=""/> <p class="wp-block-paragraph"><em>Thank You for Reading!</em></p> <p class="wp-block-paragraph"><em>If you found this post valuable, feel free to share it with your network. <img src="https://s.w.org/images/core/emoji/15.0.3/72x72/1f44f.png" alt="👏" class="wp-smiley" style="height: 1em; max-height: 1em;" /></em></p> <p class="wp-block-paragraph"><em>Stay connected for more stories on </em><a href="https://medium.com/@martosi/subscribe" target="_blank" rel="noreferrer noopener"><em>Medium</em></a><em> <img src="https://s.w.org/images/core/emoji/15.0.3/72x72/270d.png" alt="✍" class="wp-smiley" style="height: 1em; max-height: 1em;" /> and </em><a href="https://www.linkedin.com/in/martosi/" target="_blank" rel="noreferrer noopener"><em>LinkedIn</em></a><em> <img src="https://s.w.org/images/core/emoji/15.0.3/72x72/1f587.png" alt="🖇" class="wp-smiley" style="height: 1em; max-height: 1em;" />.</em></p> <p>The post <a href="https://towardsdatascience.com/the-good-enough-truth/">The Good-Enough Truth</a> appeared first on <a href="https://towardsdatascience.com">Towards Data Science</a>.</p>When Predictors Collide: Mastering VIF in Multicollinear Regression
Wed, 16 Apr 2025 19:00:23 -0000
Explore how the Variance Inflation Factor helps detect and manage multicollinearity in your regression models.
The post When Predictors Collide: Mastering VIF in Multicollinear Regression appeared first on Towards Data Science.
<p class="wp-block-paragraph">In <mdspan datatext="el1744829723173" class="mdspan-comment">regression</mdspan> models, the independent variables must be not or only slightly dependent on each other, i.e. that they are not correlated. However, if such a dependency exists, this is referred to as <a href="https://towardsdatascience.com/tag/multicollinearity/" title="Multicollinearity">Multicollinearity</a> and leads to unstable models and results that are difficult to interpret. The variance inflation factor is a decisive metric for recognizing multicollinearity and indicates the extent to which the correlation with other predictors increases the variance of a regression coefficient. A high value of this metric indicates a high correlation of the variable with other independent variables in the model.</p> <p class="wp-block-paragraph">In the following article, we look in detail at multicollinearity and the VIF as a measurement tool. We also show how the VIF can be interpreted and what measures can be taken to reduce it. We also compare the indicator with other methods for measuring multicollinearity.</p> <h2 class="wp-block-heading">What is Multicollinearity?</h2> <p class="wp-block-paragraph"><a href="https://databasecamp.de/en/statistics/multicollinearity" target="_blank" rel="noreferrer noopener">Multicollinearity</a> is a phenomenon that occurs in regression analysis when two or more variables are strongly correlated with each other so that a change in one variable leads to a change in the other variable. As a result, the development of an independent variable can be predicted completely or at least partially by another variable. This complicates the prediction of linear regression to determine the influence of an independent variable on the dependent variable.</p> <p class="wp-block-paragraph">A distinction can be made between two types of multicollinearity:</p> <ul class="wp-block-list"> <li class="wp-block-list-item"><strong>Perfect Multicollinearity</strong>: a variable is an exact linear combination of another variable, for example when two variables measure the same thing in different units, such as weight in kilograms and pounds.</li> <li class="wp-block-list-item"><strong>High Degree of Multicollinearity</strong>: Here, one variable is strongly, but not completely, explained by at least one other variable. For example, there is a high correlation between a person’s education and their income, but it is not perfect multicollinearity.</li> </ul> <p class="wp-block-paragraph">The occurrence of multicollinearity in regressions leads to serious problems as, for example, the regression coefficients become unstable and react very strongly to new data, so that the overall prediction quality suffers. Various methods can be used to recognize multicollinearity, such as the correlation matrix or the variance inflation factor, which we will look at in more detail in the next section.</p> <h2 class="wp-block-heading">What is the Variance Inflation Factor (VIF)?</h2> <p class="wp-block-paragraph">The variance inflation factor (VIF) describes a diagnostic tool for regression models that helps to detect multicollinearity. It indicates the factor by which the variance of a coefficient increases due to the correlation with other variables. A high VIF value indicates a strong multicollinearity of the variable with other independent variables. This negatively influences the regression coefficient estimate and results in high standard errors. It is therefore important to calculate the VIF so that multicollinearity is recognized at an early stage and countermeasures can be taken. <mdspan datatext="el1744829524858" class="mdspan-comment">The VIF for a single variable \(i\) is calculated using this formula</mdspan>:</p> <p class="wp-block-shortcode">\[\] \[VIF = \frac{1}{(1 – R^2)}\]</p> <p class="wp-block-paragraph">Here \(R^2\) is the so-called coefficient of determination of the regression of feature \(i\) against all other independent variables. A high \(R^2\) value indicates that a large proportion of the variables can be explained by the other features, so that multicollinearity is suspected.</p> <p class="wp-block-paragraph">In a regression with the three independent variables \(X_1\), \(X_2\) and \(X_3\), for example, one would train a regression with \(X_1\) as the dependent variable and \(X_2\) and \(X_3\) as independent variables. With the help of this model, \(R_{1}^2\) could then be calculated and inserted into the formula for the VIF. This procedure would then be repeated for the remaining combinations of the three independent variables.</p> <p class="wp-block-paragraph">A typical threshold value is VIF > 10, which indicates strong multicollinearity. In the following section, we look in more detail at the interpretation of the variance inflation factor.</p> <h2 class="wp-block-heading">How can different Values of the Variance Inflation Factor be interpreted?</h2> <p class="wp-block-paragraph">After calculating the VIF, it is important to be able to evaluate what statement the value makes about the situation in the model and to be able to deduce whether measures are necessary. The values can be interpreted as follows:</p> <ul class="wp-block-list"> <li class="wp-block-list-item"><strong>VIF = 1</strong>: This value indicates that there is no multicollinearity between the analyzed variable and the other variables. This means that no further action is required.</li> <li class="wp-block-list-item"><strong>VIF between 1 and 5</strong>: If the value is in the range between 1 and 5, then there is multicollinearity between the variables, but this is not large enough to represent an actual problem. Rather, the dependency is still moderate enough that it can be absorbed by the model itself.</li> <li class="wp-block-list-item"><strong>VIF > 5</strong>: In such a case, there is already a high degree of multicollinearity, which requires intervention in any case. The standard error of the predictor is likely to be significantly excessive, so the regression coefficient may be unreliable. Consideration should be given to combining the correlated predictors into one variable.</li> <li class="wp-block-list-item"><strong>VIF > 10</strong>: With such a value, the variable has serious multicollinearity and the regression model is very likely to be unstable. In this case, consideration should be given to removing the variable to obtain a more powerful model.</li> </ul> <p class="wp-block-paragraph">Overall, a high VIF value indicates that the variable may be redundant, as it is highly correlated with other variables. In such cases, various measures should be taken to reduce multicollinearity.</p> <h2 class="wp-block-heading">What measures help to reduce the VIF?</h2> <p class="wp-block-paragraph">There are various ways to circumvent the effects of multicollinearity and thus also reduce the variance inflation factor. The most popular measures include:</p> <ul class="wp-block-list"> <li class="wp-block-list-item"><strong>Removing highly correlated variables</strong>: Especially with a high VIF value, removing individual variables with high multicollinearity is a good tool. This can improve the results of the regression, as redundant variables estimate the coefficients more unstable.</li> <li class="wp-block-list-item"><strong><a href="https://databasecamp.de/en/statistics/principal-component-analysis-en" target="_blank" rel="noreferrer noopener">Principal component analysis (PCA)</a></strong>: The core idea of principal component analysis is that several variables in a data set may measure the same thing, i.e. be correlated. This means that the various dimensions can be combined into fewer so-called principal components without compromising the significance of the data set. Height, for example, is highly correlated with shoe size, as tall people often have taller shoes and vice versa. This means that the correlated variables are then combined into uncorrelated main components, which reduces multicollinearity without losing important information. However, this is also accompanied by a loss of interpretability, as the principal components do not represent real characteristics, but a combination of different variables.</li> <li class="wp-block-list-item"><strong>Regularization Methods</strong>: Regularization comprises various methods that are used in statistics and machine learning to control the complexity of a model. It helps to react robustly to new and unseen data and thus enables the generalizability of the model. This is achieved by adding a penalty term to the model’s optimization function to prevent the model from adapting too much to the training data. This approach reduces the influence of highly correlated variables and lowers the VIF. At the same time, however, the accuracy of the model is not affected.</li> </ul> <p class="wp-block-paragraph">These methods can be used to effectively reduce the VIF and combat multicollinearity in a regression. This makes the results of the model more stable and the standard error can be better controlled.</p> <h2 class="wp-block-heading">How does the VIF compare to other methods?</h2> <p class="wp-block-paragraph">The variance inflation factor is a widely used technique to measure multicollinearity in a data set. However, other methods can offer specific advantages and disadvantages compared to the VIF, depending on the application.</p> <h3 class="wp-block-heading"><strong>Correlation Matrix</strong></h3> <p class="wp-block-paragraph">The <a href="https://databasecamp.de/en/ml/correlation-matrix" target="_blank" rel="noreferrer noopener">correlation matrix</a> is a statistical method for quantifying and comparing the relationships between different variables in a data set. The pairwise correlations between all combinations of two variables are shown in a tabular structure. Each cell in the matrix contains the so-called correlation coefficient between the two variables defined in the column and the row.</p> <p class="wp-block-paragraph">This value can be between -1 and 1 and provides information on how the two variables relate to each other. A positive value indicates a positive correlation, meaning that an increase in one variable leads to an increase in the other variable. The exact value of the correlation coefficient provides information on how strongly the variables move about each other. With a negative correlation coefficient, the variables move in opposite directions, meaning that an increase in one variable leads to a decrease in the other variable. Finally, a coefficient of 0 indicates that there is no correlation.</p> <figure class="wp-block-image aligncenter"><img decoding="async" src="https://databasecamp.de/wp-content/uploads/Screenshot-2025-02-18-at-10.10.05%E2%80%AFAM-1.png" alt="" class="wp-image-12262"/><figcaption class="wp-element-caption">Example of a Correlation Matrix | Source: Author</figcaption></figure> <p class="wp-block-paragraph">A correlation matrix therefore fulfills the purpose of presenting the correlations in a data set in a quick and easy-to-understand way and thus forms the basis for subsequent steps, such as model selection. This makes it possible, for example, to recognize multicollinearity, which can cause problems with regression models, as the parameters to be learned are distorted.</p> <p class="wp-block-paragraph">Compared to the VIF, the correlation matrix only offers a surface analysis of the correlations between variables. However, the biggest difference is that the correlation matrix only shows the pairwise comparisons between variables and not the simultaneous effects between several variables. In addition, the VIF is more useful for quantifying exactly how much multicollinearity affects the estimate of the coefficients.</p> <h3 class="wp-block-heading">Eigenvalue Decomposition</h3> <p class="wp-block-paragraph">Eigenvalue decomposition is a method that builds on the correlation matrix and mathematically helps to identify multicollinearity. Either the correlation matrix or the covariance matrix can be used. In general, small eigenvalues indicate a stronger, linear dependency between the variables and are therefore a sign of multicollinearity.</p> <p class="wp-block-paragraph">Compared to the VIF, the eigenvalue decomposition offers a deeper mathematical analysis and can in some cases also help to detect multicollinearity that would have remained hidden by the VIF. However, this method is much more complex and difficult to interpret.</p> <p class="wp-block-paragraph">The VIF is a simple and easy-to-understand method for detecting multicollinearity. Compared to other methods, it performs well because it allows a precise and direct analysis that is at the level of the individual variables.</p> <h2 class="wp-block-heading">How to detect Multicollinearity in Python?</h2> <p class="wp-block-paragraph">Recognizing multicollinearity is a crucial step in data preprocessing in machine learning to train a model that is as meaningful and robust as possible. In this section, we therefore take a closer look at how the VIF can be calculated in <a href="https://towardsdatascience.com/tag/python/" title="Python">Python</a> and how the correlation matrix is created.</p> <h3 class="wp-block-heading">Calculating the Variance Inflation Factor in Python</h3> <p class="wp-block-paragraph">The <a href="https://towardsdatascience.com/tag/variance-inflation-factor/" title="Variance Inflation Factor">Variance Inflation Factor</a> can be easily used and imported in Python via the <code>statsmodels</code> library. Assuming we already have a Pandas DataFrame in a variable <code>X</code> that contains the independent variables, we can simply create a new, empty DataFrame for calculating the VIFs. The variable names and values are then saved in this frame.</p> <figure class="wp-block-image aligncenter"><img decoding="async" src="https://databasecamp.de/wp-content/uploads/Collinearity-2-1024x246.png" alt="Collinearity" class="wp-image-9208"/></figure> <p class="wp-block-paragraph">A new row is created for each independent variable in <code>X</code> in the <code>Variable</code> column. It is then iterated through all variables in the data set and the variance inflation factor is calculated for the values of the variables and again saved in a list. This list is then stored as column VIF in the DataFrame.</p> <h3 class="wp-block-heading">Calculating the Correlation Matrix</h3> <p class="wp-block-paragraph">In Python, a correlation matrix can be easily calculated using Pandas and then visualized as a heatmap using Seaborn. To illustrate this, we generate random data using NumPy and store it in a DataFrame. As soon as the data is stored in a DataFrame, the correlation matrix can be created using the <code>corr()</code> function.</p> <p class="wp-block-paragraph">If no parameters are defined within the function, the Pearson coefficient is used by default to calculate the correlation matrix. Otherwise, you can also define a different correlation coefficient using the method parameter.</p> <figure class="wp-block-image aligncenter"><img decoding="async" src="https://databasecamp.de/wp-content/uploads/Correlation-Matrix-1-1-785x1024.png" alt="Correlation Matrix / Korrelationsmatrix" class="wp-image-11624"/></figure> <p class="wp-block-paragraph">Finally, the heatmap is visualized using <code>seaborn</code>. To do this, the <code>heatmap()</code> function is called and the correlation matrix is passed. Among other things, the parameters can be used to determine whether the labels should be added and the color palette can be specified. The diagram is then displayed with the help of <code>matplolib</code>.</p> <h2 class="wp-block-heading">This is what you should take with you</h2> <ul class="wp-block-list"> <li class="wp-block-list-item">The variance inflation factor is a key indicator for recognizing multicollinearity in a regression model.</li> <li class="wp-block-list-item">The coefficient of determination of the independent variables is used for the calculation. Not only the correlation between two variables can be measured, but also combinations of variables.</li> <li class="wp-block-list-item">In general, a reaction should be taken if the VIF is greater than five, and appropriate measures should be introduced. For example, the affected variables can be removed from the data set or the principal component analysis can be performed.</li> <li class="wp-block-list-item">In Python, the VIF can be calculated directly using statsmodels. To do this, the data must be stored in a DataFrame. The correlation matrix can also be calculated using Seaborn to detect multicollinearity.</li> </ul> <p>The post <a href="https://towardsdatascience.com/when-predictors-collide-mastering-vif-in-multicollinear-regression/">When Predictors Collide: Mastering VIF in Multicollinear Regression</a> appeared first on <a href="https://towardsdatascience.com">Towards Data Science</a>.</p>An Unbiased Review of Snowflake’s Document AI
Tue, 15 Apr 2025 23:46:51 -0000
Or, how we spared a human from manually inspecting 10,000 flu shot documents.
The post An Unbiased Review of Snowflake’s Document AI appeared first on Towards Data Science.
<p class="wp-block-paragraph">As data <mdspan datatext="el1744747249097" class="mdspan-comment">professionals</mdspan>, we’re comfortable with tabular data…</p> <figure class="wp-block-image aligncenter size-full is-resized"><img decoding="async" src="https://contributor.insightmediagroup.io/wp-content/uploads/2025/04/image-46.png" alt="" class="wp-image-601545" style="width:657px;height:auto"/><figcaption class="wp-element-caption">Tabular data. Image by Author.</figcaption></figure> <p class="wp-block-paragraph">We can also handle words, json, xml feeds, and pictures of cats. But what about a cardboard box full of things like this? </p> <figure class="wp-block-image aligncenter size-full is-resized"><img decoding="async" src="https://contributor.insightmediagroup.io/wp-content/uploads/2025/04/annie-spratt-recgFWxDO1Y-unsplash.jpg" alt="" class="wp-image-601544" style="width:437px;height:auto"/><figcaption class="wp-element-caption">(Image by Annie Spratt, <a href="https://unsplash.com/photos/a-receipt-sitting-on-top-of-a-wooden-table-recgFWxDO1Y">Unsplash</a>)</figcaption></figure> <p class="wp-block-paragraph">The info on this receipt wants so badly to be in a tabular database somewhere. Wouldn’t it be great if we could scan all these, run them through an LLM, and save the results in a table? </p> <p class="wp-block-paragraph">Lucky for us, we live in the era of <a href="https://towardsdatascience.com/tag/document-ai/" title="Document Ai">Document Ai</a>. Document AI combines OCR with LLMs and allows us to build a bridge between the paper world and the digital database world.</p> <p class="wp-block-paragraph">All the major cloud vendors have some version of this… </p> <ul class="wp-block-list"> <li class="wp-block-list-item"><a href="https://cloud.google.com/document-ai?hl=en">Google (Document AI)</a>, </li> <li class="wp-block-list-item"><a href="https://www.microsoft.com/en-us/research/project/document-ai/">Microsoft (Document AI)</a> </li> <li class="wp-block-list-item"><a href="https://aws.amazon.com/ai/generative-ai/use-cases/document-processing/">AWS (Intelligent Document Processing</a>)</li> <li class="wp-block-list-item"><a href="https://docs.snowflake.com/en/user-guide/snowflake-cortex/document-ai/overview">Snowflake (Document AI)</a></li> </ul> <p class="wp-block-paragraph">Here I’ll share my thoughts on Snowflake’s Document AI. Aside from using Snowflake at work, I have no affiliation with Snowflake. They didn’t commission me to write this piece and I’m not part of any ambassador program. All of that is to say I can write an <em>unbiased</em> review of <a href="https://docs.snowflake.com/en/user-guide/snowflake-cortex/document-ai/overview">Snowflake’s Document AI</a>.<br></p> <hr class="wp-block-separator has-alpha-channel-opacity is-style-dotted"/> <h2 class="wp-block-heading">What is Document AI? </h2> <p class="wp-block-paragraph">Document AI allows users to quickly extract information from digital documents. When we say “documents” we mean pictures with words. Don’t confuse this with <a href="https://aws.amazon.com/documentdb/">niche NoSQL things</a>. </p> <p class="wp-block-paragraph">The product combines OCR and LLM models so that a user can create a set of prompts and execute those prompts against a large collection of documents all at once. </p> <figure class="wp-block-image size-large"><img decoding="async" src="https://contributor.insightmediagroup.io/wp-content/uploads/2025/04/image-47-1024x430.png" alt="" class="wp-image-601546"/><figcaption class="wp-element-caption">Snowflake’s Document AI on a (scrubbed) resume. Image by author.</figcaption></figure> <p class="wp-block-paragraph">LLMs and OCR both have room for error. Snowflake solved this by (1) banging their heads against OCR until it’s sharp — I see you, Snowflake developer — and (2) letting me fine-tune my LLM. </p> <p class="wp-block-paragraph">Fine-tuning the Snowflake LLM feels a lot more like <a href="https://www.merriam-webster.com/dictionary/glamping">glamping</a> than some rugged outdoor adventure. I review 20+ documents, hit the “train model” button, then rinse and repeat until performance is satisfactory. Am I even a data scientist anymore?</p> <p class="wp-block-paragraph">Once the model is trained, I can run my prompts on 1000 documents at a time. I like to save the results to a table but you could do whatever you want with the results real time.</p> <hr class="wp-block-separator has-alpha-channel-opacity is-style-dotted"/> <h2 class="wp-block-heading">Why does it matter? </h2> <p class="wp-block-paragraph">This product is cool for several reasons.</p> <ul class="wp-block-list"> <li class="wp-block-list-item">You can build a bridge between the paper and digital world. I never thought the big box of paper invoices under my desk would make it into my cloud data warehouse, but now it can. Scan the paper invoice, upload it to snowflake, run my Document AI model, and wham! I have my desired information parsed into a tidy table.<br></li> <li class="wp-block-list-item">It’s frighteningly convenient to invoke a machine-learning model via SQL. Why didn’t we think of this sooner? In a old times this was a few hundred of lines of code to load the raw data (SQL >> python/spark/etc.), clean it, engineer features, train/test split, train a model, make predictions, and then often write the predictions back into SQL. </li> </ul> <ul class="wp-block-list"> <li class="wp-block-list-item">To build this in-house would be a major undertaking. Yes, OCR has been around a long time but can still be finicky. Fine-tuning an LLM obviously hasn’t been around too long, but is getting easier by the week. To piece these together in a way that achieves high accuracy for a variety of documents could take a long time to hack on your own. Months of months of polish. </li> </ul> <p class="wp-block-paragraph">Of course some elements are still built in house. Once I extract information from the document I have to figure out what to do with that information. That’s relatively quick work, though.</p> <hr class="wp-block-separator has-alpha-channel-opacity is-style-dotted"/> <h2 class="wp-block-heading">Our Use Case — Bring on Flu Season:</h2> <p class="wp-block-paragraph">I work at a company called <a href="https://www.intelycare.com/">IntelyCare</a>. We operate in the <a href="https://towardsdatascience.com/tag/healthcare/" title="Healthcare">Healthcare</a> staffing space, which means we help hospitals, nursing homes, and rehab centers find quality clinicians for individual shifts, extended contracts, or full-time/part-time engagements. </p> <p class="wp-block-paragraph">Many of our facilities require clinicians to have an up-to-date flu shot. Last year, our clinicians submitted over 10,000 flu shots in addition to hundreds of thousands of other documents. We manually reviewed all of these manually to ensure validity. Part of the joy of working in the healthcare staffing world!</p> <p class="wp-block-paragraph"><strong>Spoiler Alert: Using Document AI, we were able to reduce the number of flu-shot documents needing manual review by ~50% and all in just a couple of weeks.</strong></p> <p class="wp-block-paragraph">To pull this off, we did the following:</p> <ul class="wp-block-list"> <li class="wp-block-list-item">Uploaded a pile of flu-shot documents to <a href="https://towardsdatascience.com/tag/snowflake/" title="Snowflake">Snowflake</a>.</li> </ul> <ul class="wp-block-list"> <li class="wp-block-list-item">Massaged the prompts, trained the model, massaged the prompts some more, retrained the model some more… </li> <li class="wp-block-list-item">Built out the logic to compare the model output against the clinician’s profile (e.g. do the names match?). Definitely some trial and error here with formatting names, dates, etc.</li> <li class="wp-block-list-item">Built out the “decision logic” to either approve the document or send it back to the humans.</li> <li class="wp-block-list-item">Tested the full pipeline on bigger pile of manually reviewed documents. Took a close look at any false positives.</li> <li class="wp-block-list-item">Repeated until our confusion matrix was satisfactory.</li> </ul> <p class="wp-block-paragraph">For this project, false positives pose a business risk. We don’t want to approve a document that’s expired or missing key information. We kept iterating until the false-positive rate hit zero. We’ll have some false positives eventually, but fewer than what we have now with a human review process. </p> <p class="wp-block-paragraph">False negatives, however, are harmless. If our pipeline doesn’t like a flu shot, it simply routes the document to the human team for review. If they go on to approve the document, it’s business as usual. </p> <p class="wp-block-paragraph">The model does well with the clean/easy documents, which account for ~50% of all flu shots. If it’s messy or confusing, it goes back to the humans as before. </p> <hr class="wp-block-separator has-alpha-channel-opacity is-style-dotted"/> <h2 class="wp-block-heading">Things we learned along the way</h2> <ol class="wp-block-list"> <li class="wp-block-list-item"><em>The model does best at reading the document, not making decisions or doing math based on the document.</em></li> </ol> <p class="wp-block-paragraph">Initially, our prompts attempted to determine validity of the document.</p> <p class="has-text-align-center wp-block-paragraph"><br>Bad: <em>Is the document already expired?</em></p> <p class="has-text-align-left wp-block-paragraph"><br>We found it <em>far</em> more effective to limit our prompts to questions that could be answered by looking at the document. The LLM doesn’t <em>determine</em> anything. It just grabs the relevant data points off the page.</p> <p class="has-text-align-center wp-block-paragraph"><br>Good: <em>What is the expiration date? </em><br></p> <p class="wp-block-paragraph">Save the results and do the math downstream. <br></p> <ol start="2" class="wp-block-list"> <li class="wp-block-list-item"><strong>You still need to be thoughtful about training data</strong></li> </ol> <p class="wp-block-paragraph">We had a few duplicate flu shots from one clinician in our training data. Call this clinician Ben. One of our prompts was, “what is the patient’s name?” Because “Ben” was in the training data multiple times, any remotely unclear document would return with “Ben” as the patient name. <br><br>So overfitting is still a thing. Over/under sampling is still a thing. We tried again with a more thoughtful collection of training documents and things did much better.</p> <p class="wp-block-paragraph">Document AI is pretty magical, but not <em>that</em> magical. Fundamentals still matter. <br></p> <ol start="3" class="wp-block-list"> <li class="wp-block-list-item"><strong>The model could be fooled by writing on a napkin.</strong></li> </ol> <p class="wp-block-paragraph">To my knowledge, Snowflake does not have a way to render the document image as an <a href="https://abdulkaderhelwan.medium.com/introduction-to-image-embeddings-55b8247d13f2">embedding</a>. You can create an embedding from the extracted text, but that won’t tell you if the text was written by hand or not. As long as the <em>text</em> is valid, the model and downstream logic will give it a green light.</p> <p class="wp-block-paragraph">You could fix this pretty easily by comparing image embeddings of submitted documents to the embeddings of accepted documents. Any document with an embedding way out in left field is sent back for human review. This is straightforward work, but you’ll have to do it outside Snowflake for now. <br></p> <ol start="4" class="wp-block-list"> <li class="wp-block-list-item"><strong>Not as expensive as I was expecting </strong></li> </ol> <p class="wp-block-paragraph">Snowflake has a reputation of being spendy. And for HIPAA compliance concerns we run a higher-tier Snowflake account for this project. I tend to worry about running up a Snowflake tab.</p> <p class="wp-block-paragraph">In the end we had to try extra hard to spend more than $100/week while training the model. We ran thousands of documents through the model every few days to measure its accuracy while iterating on the model, but never managed to break the budget. </p> <p class="wp-block-paragraph">Better still, we’re saving money on the manual review process. The costs for AI reviewing 1000 documents (approves ~500 documents) is ~20% of the cost we spend on humans reviewing the remaining 500. All in, a 40% reduction in costs for reviewing flu-shots.</p> <hr class="wp-block-separator has-alpha-channel-opacity is-style-dotted"/> <h2 class="wp-block-heading">Summing up</h2> <p class="wp-block-paragraph">I’ve been impressed with how quickly we could complete a project of this scope using Document AI. We’ve gone from months to days. I give it 4 stars out of 5, and am open to giving it a 5th star if Snowflake ever gives us access to image embeddings. </p> <p class="wp-block-paragraph">Since flu shots, we’ve deployed similar models for other documents with similar or better results. And with all this prep work, instead of dreading the upcoming flu season, we’re ready to bring it on. </p> <p class="wp-block-paragraph"></p> <p>The post <a href="https://towardsdatascience.com/an-unbiased-review-of-snowflakes-document-ai/">An Unbiased Review of Snowflake’s Document AI</a> appeared first on <a href="https://towardsdatascience.com">Towards Data Science</a>.</p>Plotly’s AI Tools Are Redefining Data Science Workflows
Tue, 15 Apr 2025 16:35:01 -0000
How Plotly’s AI-powered tools are transforming data science workflows with faster development, smarter insights, and improved collaboration.
The post Plotly’s AI Tools Are Redefining Data Science Workflows appeared first on Towards Data Science.
<p class="wp-block-paragraph">Is there anything more frustrating than building a powerful data model but then struggling to turn it into a tool stakeholders can use to achieve their desired outcome? <a href="https://towardsdatascience.com/tag/data-science/" title="Data Science">Data Science</a> has never been short on potential but is also never short on complexity. You can refine algorithms that shine on curated datasets but still face the hurdle of moving from prototypes and notebooks to production apps. This last step, often called the “last mile,” <a href="https://www.predinfer.com/blog/first-middle-last-mile-problems-of-data-science/">affects 80% of data science outcomes</a> and demands solutions that don’t overload data teams. </p> <p class="wp-block-paragraph">Since its founding in 2013, Plotly has been a popular subject in Towards Data Science (TDS), where contributors have <a href="https://towardsdatascience.com/tag/plotly/">published over 100 guides on Plotly’s tools</a>. That steady output shows how much the data science community values merging code, visualizations, and interactive dashboards.</p> <p class="wp-block-paragraph">Plotly’s Chief Product Officer, Chris Parmer, has always championed the idea that analysts should be able to “spin up interactive apps without wrestling entire web frameworks.” That vision now powers Plotly’s latest release of <a href="https://go.plotly.com/elevate-your-analytics?utm_source=Webinar:%20Dash%20Enterprise%205.7&utm_medium=Towards_Data_Science&utm_content=article_aitools">Dash Enterprise</a>, designed to simplify the leap from model to production-grade data apps. </p> <p class="wp-block-paragraph">Plotly’s latest innovations reflect a shift in data science toward more accessible, production-ready tools that help teams turn insights into actionable solutions.</p> <p class="wp-block-paragraph">This article will address three key questions: </p> <ul class="wp-block-list"> <li class="wp-block-list-item">What makes the last mile in data science so challenging? </li> <li class="wp-block-list-item">What bottlenecks make traditional data workflows slow and inefficient? </li> <li class="wp-block-list-item">And how can you apply Plotly’s AI capabilities to build, share, and deploy <a href="https://plotly.com/blog/what-is-a-data-app?utm_medium=Towards_Data_Science&utm_content=article_aitools">interactive data apps</a> faster?</li> </ul> <h2 class="wp-block-heading">Confronting the Last Mile Problem</h2> <p class="wp-block-paragraph">The “last mile” in data science can be grueling. You might spend months perfecting models, only to find that nobody outside your analytics team fully understands the outputs. Static notebooks or ad hoc scripts rarely offer the interactivity that decision-makers require. </p> <p class="wp-block-paragraph">Some teams settle for a quick proof of concept using a Jupyter Notebook or single script, hoping to show value quickly. Many never upgrade it unless an organization invests in costly infrastructure. Smaller groups might not have the time or resources to turn prototypes into tools that influence daily decisions.</p> <figure class="wp-block-image alignwide size-full"><img decoding="async" src="https://contributor.insightmediagroup.io/wp-content/uploads/2025/04/TDS-1-1.jpeg" alt="" class="wp-image-600981"/><figcaption class="wp-element-caption"><a href="https://www.linkedin.com/feed/update/urn:li:activity:6864264501315874816/?%20commentUrn=urn%3Ali%3Acomment%3A(activity%3A6864264501315874816%2C6%20866097309462224896"><em>The last mile problem in data science. Adapted from Brent Dykes</em></a></figcaption></figure> <p class="wp-block-paragraph">In large companies, security protocols, role-based access, and continuous deployment can add more complexity. These layers can push you into roles that look a lot like full-stack development just to get your insights presented to stakeholders. Delays pile up, especially when senior leaders want to test live scenarios but must wait for code changes to see fresh metrics.</p> <p class="wp-block-paragraph">Teams must move beyond isolated notebooks and manual workflows to adopt automated, interactive tools that turn insights into action faster. Plotly addresses this need by <a href="https://plotly.com/dash/plotly-ai/?utm_medium=Towards_Data_Science&utm_content=article_aitools">embedding AI into Dash</a>. <br>Plotly Dash is an open source Python framework for building interactive web applications for analytics. It simplifies the process of creating web-based interfaces for data analysis and presentation without requiring extensive web development knowledge. </p> <p class="wp-block-paragraph">Plotly Dash Enterprise extends and augments the open source framework to enable the creation of sophisticated production-grade applications for operational decision-making. Plotly Dash Enterprise provides development features and platform and security capabilities that enterprises require, such as AI, App Gallery, DevOps, security integration, caching, and much more.</p> <p class="wp-block-paragraph">The latest release of Dash Enterprise automates repetitive tasks, generates Python code for data visualizations and apps, and accelerates development inside Plotly App Studio. These enhancements free you to focus on refining models, improving insights, and delivering apps that meet business needs.</p> <h2 class="wp-block-heading">Inside Dash Enterprise: AI Chat, Data Explorer, and More</h2> <p class="wp-block-paragraph"><a href="https://go.plotly.com/elevate-your-analytics?utm_source=Webinar:%20Dash%20Enterprise%205.7&utm_medium=Towards_Data_Science&utm_content=article_aitools">Plotly’s newest release of Dash Enterprise</a> puts AI front and center. Its “Plotly AI” feature includes a chat interface that turns your plain-English prompts, like “build a sales forecast dashboard using our monthly SQL data,” into functional Python code. As an advanced user, you can refine that code with custom logic, and if you’re less technical, you can now build prototypes that once required specialized help. </p> <p class="wp-block-paragraph"><a href="https://www.youtube.com/watch?v=FqAO3UWsNBw">Parmer explains</a>, </p> <blockquote class="wp-block-quote is-layout-flow wp-block-quote-is-layout-flow"> <p class="wp-block-paragraph"><em>“By integrating advanced AI directly into Dash, we’re streamlining the entire development process. You can start with an idea or a dataset and see a functional web app appear faster than ever.” </em></p> </blockquote> <p class="wp-block-paragraph">Dash Enterprise also introduces a Data Explorer Mode that you can use to generate charts, apply filters, and change parameters without writing code. For data scientists who prefer a direct code workflow, it provides flexibility to refine automatically generated components. The update goes further with integrated SQL authoring cells and simpler app embedding, cutting the distance from concept to production.</p> <figure class="wp-block-embed is-type-video is-provider-youtube wp-block-embed-youtube wp-embed-aspect-16-9 wp-has-aspect-ratio"><div class="wp-block-embed__wrapper"> <iframe loading="lazy" title="Demo: App Studio — Build Data Apps Smarter with Plotly AI" width="500" height="281" src="https://www.youtube.com/embed/FqAO3UWsNBw?feature=oembed" frameborder="0" allow="accelerometer; autoplay; clipboard-write; encrypted-media; gyroscope; picture-in-picture; web-share" referrerpolicy="strict-origin-when-cross-origin" allowfullscreen></iframe> </div></figure> <p class="wp-block-paragraph">User experience takes a big step forward in the latest version of Dash Enterprise through App Studio, a GUI-based environment for creating and refining Dash apps. As the large language model (LLM) converts your prompts into Python code, that code is fully visible and editable within the interface. You’re never blocked from directly modifying or extending the generated code, giving you the flexibility to fine-tune every aspect of your app. </p> <p class="wp-block-paragraph">This mix of AI-assisted development and accessible design means data apps no longer require separate teams or complex frameworks. As Parmer puts it, “It’s not enough for data scientists to produce brilliant models if no one else can explore or understand them. Our goal is to remove the hurdles so people can share insights with minimal fuss.” </p> <h2 class="wp-block-heading">What Dash Enterprise Means for Your Data Projects </h2> <p class="wp-block-paragraph">If you already have an established workflow, you might wonder why this Dash Enterprise release matters. Even the most accurate models can flop if decision-makers can’t interact with the results. With the new release, you can reduce the overhead of building data apps and deliver insights faster by: </p> <ul class="wp-block-list"> <li class="wp-block-list-item">Building richer visualizations to present deeper insights with interactive charts and dashboards that adapt to your data story. You can see how <a href="https://plotly.com/user-stories/cibc/?utm_medium=Towards_Data_Science&utm_content=article_aitools">CIBC’s Quantitative Solutions group</a> used Dash Enterprise to help analysts and trading desks develop production-grade apps tailored to their needs.</li> <li class="wp-block-list-item">Using the new GUI-based App Studio to build, modify, and extend data apps without writing code, while still accessing Python for complete control. <a href="https://plotly.com/user-stories/intuit/?utm_medium=Towards_Data_Science&utm_content=article_aitools">Intuit’s experimentation team</a> took this approach to create tools now used by more than 500 employees, reducing experiment runtimes by over 70 percent.</li> <li class="wp-block-list-item">Managing complex datasets confidently by integrating Dash Enterprise with tools like Databricks to maintain performance as data scales. <a href="https://plotly.com/user-stories/sp-global/?utm_medium=Towards_Data_Science&utm_content=article_aitools">S&P Global</a> adopted this approach to reduce the time it takes to launch client-facing data products from nine months to just two.</li> <li class="wp-block-list-item">Adding security and control with built-in security features, version control, and role-based access to protect your data apps as they grow. CIBC relied on these capabilities to deploy applications across teams in different regions without compromising security.</li> </ul> <p class="wp-block-paragraph">If you’re on an MLOps team, you may find it simpler to tie together data transformations and user permissions. This is non-negotiable in finance, healthcare, and supply chain analytics, where timely decisions rely on live data. By reducing the manual effort required to manage pipelines, you can spend more time refining models and delivering insights faster. </p> <p class="wp-block-paragraph">With Plotly’s open and extensible approach, you’re not locked into vendor-specific algorithms. Instead, you can embed any Python-based ML model or analytics workflow directly within Dash. This design has proven valuable at <a href="https://plotly.com/blog/data-ai-summit-plotly-reflections/?utm_medium=Towards_Data_Science&utm_content=article_aitools">Databricks</a>, where the team built an observability application to monitor infrastructure usage and costs using Plotly Dash. </p> <p class="wp-block-paragraph">Teams at <a href="https://plotly.com/blog/data-ai-summit-plotly-reflections/?utm_medium=Towards_Data_Science&utm_content=article_aitools">Shell and Bloomberg</a> also adopted Plotly Dash Enterprise for use cases spanning data governance, high-density visualizations, thematic investing, and more—all highlighting how these capabilities connect data, AI and BI in a single-user experience.</p> <h2 class="wp-block-heading">So, What’s Next? </h2> <p class="wp-block-paragraph">AI is changing how data applications are built, data products are delivered, and insights are shared. Plotly sits at the crossroads of app development, data storytelling, and enterprise needs. To see how Plotly addresses this shift, <a href="https://go.plotly.com/elevate-your-analytics?utm_source=Webinar:%20Dash%20Enterprise%205.7&utm_medium=Towards_Data_Science&utm_content=article_aitools">watch the launch webinar</a> and stay tuned for an upcoming eBook that breaks down proven strategies for building smarter data apps with AI.</p> <p class="wp-block-paragraph">Embedding AI into Dash automates parts of the development process, making data apps easier for non-technical teams. Yet technical skills and thoughtful planning remain key to building reliable, practical solutions.The world of data has moved beyond scattered notebooks and short-lived prototypes. The focus is now on production-ready solutions that guide meaningful decisions. With AI expanding rapidly, the gap between <strong>“experimental analysis</strong>” and “<strong>operational decision-making</strong>” may finally narrow — something many of you have been waiting for.</p> <hr class="wp-block-separator has-alpha-channel-opacity is-style-dotted"/> <p class="wp-block-paragraph"><strong>About Our Sponsor</strong><br>Plotly is a leading provider of open-source graphing libraries and enterprise-grade analytics solutions. Its flagship product, Dash Enterprise, enables organizations to build scalable and interactive data apps that drive impactful decision-making. Learn more at <a href="http://www.plotly.com?utm_medium=Towards_Data_Science&utm_content=article_aitools" target="_blank" rel="noreferrer noopener">http://www.plotly.com</a>.</p> <p>The post <a href="https://towardsdatascience.com/plotlys-ai-tools-are-redefining-data-science-workflows/">Plotly’s AI Tools Are Redefining Data Science Workflows </a> appeared first on <a href="https://towardsdatascience.com">Towards Data Science</a>.</p>An LLM-Based Workflow for Automated Tabular Data Validation
Mon, 14 Apr 2025 19:25:32 -0000
Clean data, clear insights: detect and correct data quality issues without manual intervention.
The post An LLM-Based Workflow for Automated Tabular Data Validation appeared first on Towards Data Science.
<p class="has-text-align-left wp-block-paragraph"><mdspan datatext="el1744658426682" class="mdspan-comment">This article</mdspan> is part of a series of articles on automating data cleaning for any tabular dataset:</p> <ul class="wp-block-list"> <li class="wp-block-list-item"><a href="https://towardsdatascience.com/effortless-spreadsheet-normalisation-with-llm/">Effortless Spreadsheet Normalisation With LLM</a></li> </ul> <p class="wp-block-paragraph">You can test the feature described in this article on your own dataset using the <a href="https://cleanmyexcel.io/">CleanMyExcel.io</a> service, which is free and requires no registration.</p> <h2 class="wp-block-heading">What is Data Validity?</h2> <p class="wp-block-paragraph">Data validity refers to data conformity to expected formats, types, and value ranges. This standardisation within a single column ensures the uniformity of data according to implicit or explicit requirements.</p> <p class="wp-block-paragraph">Common issues related to data validity include:</p> <ul class="wp-block-list"> <li class="wp-block-list-item">Inappropriate variable types: Column data types that are not suited to analytical needs, e.g., temperature values in text format.</li> <li class="wp-block-list-item">Columns with mixed data types: A single column containing both numerical and textual data.</li> <li class="wp-block-list-item">Non-conformity to expected formats: For instance, invalid email addresses or URLs.</li> <li class="wp-block-list-item">Out-of-range values: Column values that fall outside what is allowed or considered normal, e.g., negative age values or ages greater than 30 for high school students.</li> <li class="wp-block-list-item">Time zone and DateTime format issues: Inconsistent or heterogeneous date formats within the dataset.</li> <li class="wp-block-list-item">Lack of measurement standardisation or uniform scale: Variability in the units of measurement used for the same variable, e.g., mixing Celsius and Fahrenheit values for temperature.</li> <li class="wp-block-list-item">Special characters or whitespace in numeric fields: Numeric data contaminated by non-numeric elements.</li> </ul> <p class="wp-block-paragraph">And the list goes on.</p> <p class="wp-block-paragraph">Error types such as <strong>duplicated records or entities</strong> and <strong>missing values</strong> do not fall into this category.</p> <p class="wp-block-paragraph">But what is the typical strategy to identifying such data validity issues? </p> <h2 class="wp-block-heading">When data meets expectations</h2> <p class="wp-block-paragraph">Data cleaning, while it can be very complex, can generally be broken down into two key phases:</p> <p class="wp-block-paragraph">1. Detecting data errors </p> <p class="wp-block-paragraph">2. Correcting these errors.</p> <p class="wp-block-paragraph">At its core, data cleaning revolves around identifying and resolving discrepancies in datasets—specifically, values that violate predefined constraints, which are from expectations about the data..</p> <p class="wp-block-paragraph">It’s important to acknowledge a fundamental fact: it’s almost impossible, in real-world scenarios, to be exhaustive in identifying all potential data errors—the sources of data issues are virtually infinite, ranging from human input mistakes to system failures—and thus impossible to predict entirely. However, what we <em>can</em> do is define what we consider reasonably regular patterns in our data, known as data expectations—reasonable assumptions about what “correct” data should look like. For example:</p> <ul class="wp-block-list"> <li class="wp-block-list-item">If working with a dataset of high school students, we might expect ages to fall between 14 and 18 years old.</li> <li class="wp-block-list-item">A customer database might require email addresses to follow a standard format (e.g., user@domain.com).</li> </ul> <p class="wp-block-paragraph">By establishing these expectations, we create a structured framework for detecting anomalies, making the data cleaning process both manageable and scalable.</p> <p class="wp-block-paragraph">These expectations are derived from both semantic and statistical analysis. We understand that the column name “age” refers to the well-known concept of time spent living. Other column names may be drawn from the lexical field of high school, and column statistics (e.g. minimum, maximum, mean, etc.) offer insights into the distribution and range of values. Taken together, this information helps determine our expectations for that column:</p> <ul class="wp-block-list"> <li class="wp-block-list-item">Age values should be integers</li> <li class="wp-block-list-item">Values should fall between 14 and 18</li> </ul> <p class="wp-block-paragraph">Expectations tend to be as accurate as the time spent analysing the dataset. Naturally, if a dataset is used regularly by a team daily, the likelihood of discovering subtle data issues — and therefore refining expectations — increases significantly. That said, even simple expectations are rarely checked systematically in most environments, often due to time constraints or simply because it’s not the most enjoyable or high-priority task on the to-do list.</p> <p class="wp-block-paragraph">Once we’ve defined our expectations, the next step is to check whether the data actually meets them. This means applying data constraints and looking for violations. For each expectation, one or more constraints can be defined. These <a href="https://towardsdatascience.com/tag/data-quality/" title="Data Quality">Data Quality</a> rules can be translated into programmatic functions that return a binary decision — a Boolean value indicating whether a given value violates the tested constraint.</p> <p class="wp-block-paragraph">This strategy is commonly implemented in many data quality management tools, which offer ways to detect all data errors in a dataset based on the defined constraints. An iterative process then begins to address each issue until all expectations are satisfied — i.e. no violations remain.</p> <p class="wp-block-paragraph">This strategy may seem straightforward and easy to implement in theory. However, that’s often not what we see in practice — data quality remains a major challenge and a time-consuming task in many organisations.</p> <h2 class="wp-block-heading">An LLM-based workflow to generate data expectations, detect violations, and resolve them</h2> <figure class="wp-block-image"><img decoding="async" src="https://lh7-rt.googleusercontent.com/docsz/AD_4nXcbmlZVTjnXMlPtEaASw5SoQvLywnpCiBExtnE9pN45Ak-6gmsGzdjRo7Q9xdJdV2aOtK_4IzKZEI3cXEc8SwNuGawU96vSigGikFD2fu_B-apSShpe12hON0niWRiolLpSjqeJ?key=lABtwTjQ29DDn4nC3kBCGRmV" alt=""/></figure> <p class="wp-block-paragraph">This validation workflow is split into two main components: the validation of column data types and the compliance with expectations.</p> <p class="wp-block-paragraph">One might handle both simultaneously, but in our experiments, properly converting each column’s values in a data frame beforehand is a crucial preliminary step. It facilitates data cleaning by breaking down the entire process into a series of sequential actions, which improves performance, comprehension, and maintainability. This strategy is, of course, somewhat subjective, but it tends to avoid dealing with all data quality issues at once wherever possible.</p> <p class="wp-block-paragraph">To illustrate and understand each step of the whole process, we’ll consider this generated example:</p> <figure class="wp-block-image"><img decoding="async" src="https://lh7-rt.googleusercontent.com/docsz/AD_4nXeYpouorauXeJOAvIfWyvphJT3znXGnE3phvilOjpOo0be2Q0EVw0dUbelPo32h_vmiBCvPNFwI8uGkw5ESwre9Lnyyl3zrkZsZ5tBEiQgEsXH3Q221K3behCFNaMBUkQ6L2QPI?key=lABtwTjQ29DDn4nC3kBCGRmV" alt=""/></figure> <p class="wp-block-paragraph">Examples of data validity issues are spread across the table. Each row intentionally embeds one or more issues:</p> <ul class="wp-block-list"> <li class="wp-block-list-item"><strong>Row 1:</strong> Uses a non‑standard date format and an invalid URL scheme (non‑conformity to expected formats).</li> <li class="wp-block-list-item"><strong>Row 2:</strong> Contains a price value as text (“twenty”) instead of a numeric value (inappropriate variable type).</li> <li class="wp-block-list-item"><strong>Row 3:</strong> Has a rating given as “4 stars” mixed with numeric ratings elsewhere (mixed data types).</li> <li class="wp-block-list-item"><strong>Row 4:</strong> Provides a rating value of “10”, which is out‑of‑range if ratings are expected to be between 1 and 5 (out‑of‑range value). Additionally, there is a typo in the word “Food”.</li> <li class="wp-block-list-item"><strong>Row 5:</strong> Uses a price with a currency symbol (“20€”) and a rating with extra whitespace (“5 ”), showing a lack of measurement standardisation and special characters/whitespace issues.</li> </ul> <h3 class="wp-block-heading">Validate Column Data Types</h3> <h4 class="wp-block-heading">Estimate column data types</h4> <p class="wp-block-paragraph">The task here is to determine the most appropriate data type for each column in a data frame, based on the column’s semantic meaning and statistical properties. The classification is limited to the following options: string, int, float, datetime, and boolean. These categories are generic enough to cover most data types commonly encountered.</p> <p class="wp-block-paragraph">There are multiple ways to perform this classification, including deterministic approaches. The method chosen here leverages a large language model (<a href="https://towardsdatascience.com/tag/llm/" title="Llm">Llm</a>), prompted with information about each column and the overall data frame context to guide its decision:</p> <ul class="wp-block-list"> <li class="wp-block-list-item">The list of <strong>column names</strong></li> <li class="wp-block-list-item"><strong>Representative rows</strong> from the dataset, randomly sampled</li> <li class="wp-block-list-item"><strong>Column statistics</strong> describing each column (e.g. number of unique values, proportion of top values, etc.)</li> </ul> <p class="wp-block-paragraph"><em>Example</em>:</p> <figure class="wp-block-table"><table class="has-fixed-layout"><tbody><tr><td>1. Column Name: date <br> Description: Represents the date and time information associated with each record. <br> Suggested Data Type: datetime<br><br>2. Column Name: category <br> Description: Contains the categorical label defining the type or classification of the item. <br> Suggested Data Type: string<br><br>3. Column Name: price <br> Description: Holds the numeric price value of an item expressed in monetary terms. <br> Suggested Data Type: float<br><br>4. Column Name: image_url <br> Description: Stores the web address (URL) pointing to the image of the item. <br> Suggested Data Type: string<br><br>5. Column Name: rating <br> Description: Represents the evaluation or rating of an item using a numeric score. <br> Suggested Data Type: int</td></tr></tbody></table></figure> <h4 class="wp-block-heading">Convert Column Values into the Estimated Data Type</h4> <p class="wp-block-paragraph">Once the data type of each column has been predicted, the conversion of values can begin. Depending on the table framework used, this step might differ slightly, but the underlying logic remains similar. For instance, in the <a href="https://cleanmyexcel.io/">CleanMyExcel.io</a> service, Pandas is used as the core data frame engine. However, other libraries like Polars or PySpark are equally capable within the Python ecosystem.<br>All non-convertible values are set aside for further investigation.</p> <h4 class="wp-block-heading">Analyse Non-convertible Values and Propose Substitutes</h4> <p class="wp-block-paragraph">This step can be viewed as an imputation task. The previously flagged non-convertible values violate the column’s expected data type. Because the potential causes are so diverse, this step can be quite challenging. Once again, an LLM offers a helpful trade-off to interpret the conversion errors and suggest possible replacements.<br>Sometimes, the correction is straightforward—for example, converting an age value of twenty into the integer 20. In many other cases, a substitute is not so obvious, and tagging the value with a sentinel (placeholder) value is a better choice. In Pandas, for instance, the special object pd.NA is suitable for such cases.</p> <p class="wp-block-paragraph"><em>Example</em>:</p> <figure class="wp-block-table"><table class="has-fixed-layout"><tbody><tr><td>{<br> “violations”: [<br> {<br> “index”: 2,<br> “column_name”: “rating”,<br> “value”: “4 stars”,<br> “violation”: “Contains non-numeric text in a numeric rating field.”,<br> “substitute”: “4”<br> },<br> {<br> “index”: 1,<br> “column_name”: “price”,<br> “value”: “twenty”,<br> “violation”: “Textual representation that cannot be directly converted to a number.”,<br> “substitute”: “20”<br> },<br> {<br> “index”: 4,<br> “column_name”: “price”,<br> “value”: “20€”,<br> “violation”: “Price value contains an extraneous currency symbol.”,<br> “substitute”: “20”<br> }<br> ]<br>}</td></tr></tbody></table></figure> <h4 class="wp-block-heading">Replace Non-convertible Values</h4> <p class="wp-block-paragraph">At this point, a programmatic function is applied to replace the problematic values with the proposed substitutes. The column is then tested again to ensure all values can now be converted into the estimated data type. If successful, the workflow proceeds to the expectations module. Otherwise, the previous steps are repeated until the column is validated.</p> <h3 class="wp-block-heading">Validate Column Data Expectations</h3> <h4 class="wp-block-heading">Generate Expectations for All Columns</h4> <p class="wp-block-paragraph">The following elements are provided:</p> <ul class="wp-block-list"> <li class="wp-block-list-item"><strong>Data dictionary</strong>: column name, a short description, and the expected data type</li> <li class="wp-block-list-item"><strong>Representative rows</strong> from the dataset, randomly sampled</li> <li class="wp-block-list-item"><strong>Column statistics</strong>, such as number of unique values and proportion of top values</li> </ul> <p class="wp-block-paragraph">Based on each column’s semantic meaning and statistical properties, the goal is to define validation rules and expectations that ensure data quality and integrity. These expectations should fall into one of the following categories related to standardisation:</p> <ul class="wp-block-list"> <li class="wp-block-list-item">Valid ranges or intervals</li> <li class="wp-block-list-item">Expected formats (e.g. for emails or phone numbers)</li> <li class="wp-block-list-item">Allowed values (e.g. for categorical fields)</li> <li class="wp-block-list-item">Column data standardisation (e.g. ‘Mr’, ‘Mister’, ‘Mrs’, ‘Mrs.’ becomes [‘Mr’, ‘Mrs’])</li> </ul> <p class="wp-block-paragraph"><em>Example</em>:</p> <figure class="wp-block-table"><table class="has-fixed-layout"><tbody><tr><td>Column name: date<br><br>• Expectation: Value must be a valid datetime.<br> - Reasoning: The column represents date and time information so each entry should follow a standard datetime format (for example, ISO 8601). <br>• Expectation: Datetime values should include timezone information (preferably UTC).<br> - Reasoning: The provided sample timestamps include explicit UTC timezone information. This ensures consistency in time-based analyses.<br><br>──────────────────────────────<br>Column name: category<br><br>• Expectation: Allowed values should be standardized to a predefined set.<br> - Reasoning: Based on the semantic meaning, valid categories might include “Books”, “Electronics”, “Food”, “Clothing”, and “Furniture”. (Note: The sample includes “Fod”, which likely needs correcting to “Food”.) <br>• Expectation: Entries should follow a standardized textual format (e.g., Title Case).<br> - Reasoning: Consistent capitalization and spelling will improve downstream analyses and reduce data cleaning issues.<br><br>──────────────────────────────<br>Column name: price<br><br>• Expectation: Value must be a numeric float.<br> - Reasoning: Since the column holds monetary amounts, entries should be stored as numeric values (floats) for accurate calculations.<br>• Expectation: Price values should fall within a valid non-negative numeric interval (e.g., price ≥ 0).<br> - Reasoning: Negative prices generally do not make sense in a pricing context. Even if the minimum observed value in the sample is 9.99, allowing zero or positive values is more realistic for pricing data.<br><br>──────────────────────────────<br>Column name: image_url<br><br>• Expectation: Value must be a valid URL with the expected format.<br> - Reasoning: Since the column stores image web addresses, each URL should adhere to standard URL formatting patterns (e.g., including a proper protocol schema).<br>• Expectation: The URL should start with “https://”.<br> - Reasoning: The sample shows that one URL uses “htp://”, which is likely a typo. Enforcing a secure (https) URL standard improves data reliability and user security.<br><br>──────────────────────────────<br>Column name: rating<br><br>• Expectation: Value must be an integer.<br> - Reasoning: The evaluation score is numeric, and as seen in the sample the rating is stored as an integer.<br>• Expectation: Rating values should fall within a valid interval, such as between 1 and 5.<br> - Reasoning: In many contexts, ratings are typically on a scale of 1 to 5. Although the sample includes a value of 10, it is likely a data quality issue. Enforcing this range standardizes the evaluation scale.</td></tr></tbody></table></figure> <h4 class="wp-block-heading">Generate Validation Code</h4> <p class="wp-block-paragraph">Once expectations have been defined, the goal is to create a structured code that checks the data against these constraints. The code format may vary depending on the chosen validation library, such as <a href="https://pandera.readthedocs.io/">Pandera</a> (used in <a href="https://cleanmyexcel.io/">CleanMyExcel.io</a>), <a href="https://docs.pydantic.dev/latest/">Pydantic</a>, <a href="https://greatexpectations.io/">Great Expectations</a>, <a href="https://www.soda.io/">Soda</a>, etc.</p> <p class="wp-block-paragraph">To make debugging easier, the validation code should apply checks elementwise so that when a failure occurs, the row index and column name are clearly identified. This helps to pinpoint and resolve issues effectively.</p> <h4 class="wp-block-heading">Analyse Violations and Propose Substitutes</h4> <p class="wp-block-paragraph">When a violation is detected, it must be resolved. Each issue is flagged with a short explanation and a precise location (row index + column name). An LLM is used to estimate the best possible replacement value based on the violation’s description. Again, this proves useful due to the variety and unpredictability of data issues. If the appropriate substitute is unclear, a sentinel value is applied, depending on the data frame package in use.</p> <p class="wp-block-paragraph"><em>Example</em>:</p> <figure class="wp-block-table"><table class="has-fixed-layout"><tbody><tr><td>{<br> “violations”: [<br> {<br> “index”: 3,<br> “column_name”: “category”,<br> “value”: “Fod”,<br> “violation”: “category should be one of [‘Books’, ‘Electronics’, ‘Food’, ‘Clothing’, ‘Furniture’]”,<br> “substitute”: “Food”<br> },<br> {<br> “index”: 0,<br> “column_name”: “image_url”,<br> “value”: “htp://imageexample.com/pic.jpg”,<br> “violation”: “image_url should start with ‘https://'”,<br> “substitute”: “https://imageexample.com/pic.jpg”<br> },<br> {<br> “index”: 3,<br> “column_name”: “rating”,<br> “value”: “10”,<br> “violation”: “rating should be between 1 and 5”,<br> “substitute”: “5”<br> }<br> ]<br>}</td></tr></tbody></table></figure> <p class="wp-block-paragraph">The remaining steps are similar to the iteration process used during the validation of column data types. Once all violations are resolved and no further issues are detected, the data frame is fully validated.</p> <figure class="wp-block-image"><img decoding="async" src="https://lh7-rt.googleusercontent.com/docsz/AD_4nXeimHu7_ZOMOLJy2Plhtqo3W6rQcy8m4WgLEK8FqLGVdtVA77VSeVK_p1hR8CzdyQe81hi2vORUZDSU42vEmZD4KPfnWcCWRbTAJx47tK6ZK_9_z5WvYVpCzcsIHY3DIrk07tHUqg?key=lABtwTjQ29DDn4nC3kBCGRmV" alt=""/></figure> <p class="wp-block-paragraph">You can test the feature described in this article on your own dataset using the <a href="https://cleanmyexcel.io/">CleanMyExcel.io</a> service, which is free and requires no registration.</p> <h2 class="wp-block-heading">Conclusion</h2> <p class="wp-block-paragraph">Expectations may sometimes lack domain expertise — integrating human input can help surface more diverse, specific, and reliable expectations.</p> <p class="wp-block-paragraph">A key challenge lies in automation during the resolution process. A human-in-the-loop approach could introduce more transparency, particularly in the selection of substitute or imputed values.</p> <p class="wp-block-paragraph">This article is part of a series of articles on automating data cleaning for any tabular dataset:</p> <ul class="wp-block-list"> <li class="wp-block-list-item"><a href="https://towardsdatascience.com/effortless-spreadsheet-normalisation-with-llm/">Effortless Spreadsheet Normalisation With LLM</a></li> </ul> <p class="wp-block-paragraph">In upcoming articles, we’ll explore related topics already on the roadmap, including:</p> <ul class="wp-block-list"> <li class="wp-block-list-item">A detailed description of the spreadsheet encoder used in the article above.</li> <li class="wp-block-list-item">Data uniqueness: preventing duplicate entities within the dataset.</li> <li class="wp-block-list-item">Data completeness: handling missing values effectively.</li> <li class="wp-block-list-item">Evaluating data reshaping, validity, and other key aspects of data quality.</li> </ul> <p class="wp-block-paragraph">Stay tuned!</p> <p class="wp-block-paragraph">Thank you to Marc Hobballah for reviewing this article and providing feedback.</p> <p class="wp-block-paragraph">All images, unless otherwise noted, are by the author.</p> <p>The post <a href="https://towardsdatascience.com/an-llm-based-workflow-for-automated-tabular-data-validation/">An LLM-Based Workflow for Automated Tabular Data Validation </a> appeared first on <a href="https://towardsdatascience.com">Towards Data Science</a>.</p>Layers of the AI Stack, Explained Simply
Mon, 14 Apr 2025 18:58:54 -0000
And why I decided to work at the application layer
The post Layers of the AI Stack, Explained Simply appeared first on Towards Data Science.
<p class="wp-block-paragraph"><em><img src="https://s.w.org/images/core/emoji/15.0.3/72x72/1f4d5.png" alt="📕" class="wp-smiley" style="height: 1em; max-height: 1em;" /> This is the first in a multi-part series on creating web applications with <a href="https://towardsdatascience.com/tag/generative-ai/" title="Generative Ai">Generative Ai</a> integration.</em></p> <h4 class="wp-block-heading"><mdspan datatext="el1744138592697" class="mdspan-comment">Table</mdspan> of Contents</h4> <ul class="wp-block-list"> <li class="wp-block-list-item"><a href="#intro">Introduction</a></li> <li class="wp-block-list-item"><a href="#virtue">The Virtues of the Application Layer</a></li> <li class="wp-block-list-item"><a href="#thick">Thick Wrappers</a></li> <li class="wp-block-list-item"><a href="#clippy">The Return of Clippy</a></li> <li class="wp-block-list-item"><a href="#sleep">Getting Stuff Done While You Sleep</a></li> </ul> <hr class="wp-block-separator has-alpha-channel-opacity is-style-dotted"/> <h3 class="wp-block-heading" id="intro">Introduction</h3> <p class="wp-block-paragraph">The AI space is a vast and complicated landscape. Matt Turck famously does his Machine Learning, AI, and Data (MAD) landscape every year, and it always seems to get crazier and crazier. Check out the <a href="https://mattturck.com/landscape/mad2024.pdf" target="_blank" rel="noreferrer noopener">latest one made for 2024</a>.</p> <p class="wp-block-paragraph">Overwhelming, to say the least. </p> <p class="wp-block-paragraph">However, we can use abstractions to help us make sense of this crazy landscape of ours. The primary one I will be discussing and breaking down in this article is the idea of an <strong>AI stack</strong>. A stack is just a combination of technologies that are used to build applications. Those of you familiar with web development likely know of the <strong>LAMP stack</strong>: Linux, Apache, MySQL, PHP. This is the stack that powers WordPress. Using a catchy acronym like LAMP is a good way to help us humans grapple with the complexity of the web application landscape. Those of you in the data field likely have heard of the <strong>Modern Data Stack</strong>: typically dbt, Snowflake, Fivetran, and Looker (or the <a href="https://medium.com/data-science/the-post-modern-stack-993ec3b044c1" target="_blank" rel="noreferrer noopener">Post-Modern Data Stack.</a> IYKYK). </p> <p class="wp-block-paragraph">The <strong>AI stack</strong> is similar, but in this article we will stay a bit more conceptual. I’m not going to specify specific technologies you should be using at each layer of the stack, but instead will simply name the layers, and let you decide where you fit in, as well as what tech you will use to achieve success in that layer. </p> <p class="wp-block-paragraph">There are <a href="https://www.mongodb.com/resources/basics/artificial-intelligence/ai-stack#the-ai-stack" rel="noreferrer noopener" target="_blank">many</a> <a href="https://menlovc.com/perspective/the-modern-ai-stack-design-principles-for-the-future-of-enterprise-ai-architectures/" rel="noreferrer noopener" target="_blank">ways</a> <a href="https://www.ibm.com/think/topics/ai-stack" rel="noreferrer noopener" target="_blank">to</a> <a href="https://medium.com/mongodb/understanding-the-ai-stack-in-the-era-of-generative-ai-f1fcd66e1393" target="_blank" rel="noreferrer noopener">describe</a> the AI stack. I prefer simplicity; so here is the AI stack in four layers, organized from furthest from the end user (bottom) to closest (top):</p> <ul class="wp-block-list"> <li class="wp-block-list-item"><strong>Infrastructure Layer (Bottom): </strong>The raw physical hardware necessary to train and do inference with AI. Think GPUs, TPUs, cloud services (AWS/Azure/GCP).</li> <li class="wp-block-list-item"><strong>Data Layer (Bottom): </strong>The data needed to train machine learning models, as well as the databases needed to store all of that data. Think ImageNet, TensorFlow Datasets, Postgres, MongoDB, Pinecone, etc. </li> <li class="wp-block-list-item"><strong>Model and Orchestration Layer (Middle): </strong>This refers to the actual large language, vision, and reasoning models themselves. Think GPT, Claude, Gemini, or any machine learning model. This also includes the tools<strong> </strong>developers use to build, deploy, and observe models. Think PyTorch/TensorFlow, Weights & Biases, and LangChain.</li> <li class="wp-block-list-item"><strong>Application Layer (Top): </strong>The AI-powered applications that are used by customers. Think ChatGPT, GitHub copilot, Notion, Grammarly.</li> </ul> <figure class="wp-block-image size-large"><img decoding="async" src="https://contributor.insightmediagroup.io/wp-content/uploads/2025/04/AI-Stack-1-1024x511.png" alt="AI Stack" class="wp-image-601572"/><figcaption class="wp-element-caption">Layers in the AI stack. Image by author.</figcaption></figure> <p class="wp-block-paragraph">Many companies dip their toes in several layers. For example, OpenAI has both trained GPT-4o and created the ChatGPT web application. For help with the infrastructure layer they have partnered with Microsoft to use their Azure cloud for on-demand GPUs. As for the data layer, they built web scrapers to help pull in tons of natural language data to feed to their models during training, <a href="https://www.nytimes.com/2023/12/27/business/media/new-york-times-open-ai-microsoft-lawsuit.html" rel="noreferrer noopener" target="_blank">not without controversy</a>.</p> <h3 class="wp-block-heading" id="virtue">The Virtues of the Application Layer</h3> <p class="wp-block-paragraph">I agree very much with <a href="https://www.youtube.com/watch?v=KDBq0GqKpqA&t=860s" rel="noreferrer noopener" target="_blank">Andrew Ng</a> and <a href="https://x.com/gradypb/status/1899485092247916891" rel="noreferrer noopener" target="_blank">many</a> <a href="https://www.sequoiacap.com/article/generative-ais-act-o1/" rel="noreferrer noopener" target="_blank">others</a> in the space who say that <strong>the application layer of AI is the place to be</strong>. </p> <p class="wp-block-paragraph">Why is this? Let’s start with the infrastructure layer. This layer is prohibitively expensive to break into unless you have hundreds of millions of dollars of VC cash to burn. The technical complexity of attempting to create your own cloud service or craft a new type of GPU is very high. There is a reason why tech behemoths like Amazon, Google, Nvidia, and Microsoft dominate this layer. Ditto on the foundation model layer. Companies like OpenAI and Anthropic have armies of PhDs to innovate here. In addition, they had to partner with the tech giants to fund model training and hosting. Both of these layers are also rapidly becoming <strong>commoditized</strong>. This means that one cloud service/model more or less performs like another. They are interchangeable and can be easily replaced. They mostly compete on price, convenience, and brand name.</p> <p class="wp-block-paragraph">The data layer is interesting. The advent of generative AI has led to a quite a few companies staking their claim as the most popular vector database, including Pinecone, Weaviate, and Chroma. However, the customer base at this layer is much smaller than at the application layer (there are far less developers than there are people who will use AI applications like ChatGPT). This area is also quickly become commoditized. Swapping Pinecone for Weaviate is not a difficult thing to do, and if for example Weaviate dropped their hosting prices significantly many developers would likely make the switch from another service. </p> <p class="wp-block-paragraph">It’s also important to note innovations happening at the database level. Projects such as <a href="https://github.com/pgvector/pgvector" rel="noreferrer noopener" target="_blank">pgvector</a> and <a href="https://github.com/asg017/sqlite-vec" rel="noreferrer noopener" target="_blank">sqlite-vec</a> are taking tried and true databases and making them able to handle vector embeddings. This is an area where I would like to contribute. However, the path to profit is not clear, and thinking about profit here feels a bit icky (I <img src="https://s.w.org/images/core/emoji/15.0.3/72x72/2665.png" alt="♥" class="wp-smiley" style="height: 1em; max-height: 1em;" /> open-source!)</p> <p class="wp-block-paragraph">That brings us to the application layer. <strong>This is where the little guys can notch big wins.</strong> The ability to take the latest AI tech innovations and integrate them into web applications is and will continue to be in high demand. The path to profit is clearest when offering products that people love. Applications can either be SaaS offerings or they can be custom-built applications tailored to a company’s particular use case. </p> <p class="wp-block-paragraph">Remember that the companies working on the foundation model layer are constantly working to release better, faster, and cheaper models. As an example, if you are using the <code>gpt-4o</code> model in your app, and OpenAI updates the model, you <strong>don’t have to do a thing </strong>to receive the update. Your app gets a nice bump in performance for nothing. It’s similar to how iPhones get regular updates, except even better, because no installation is required. The streamed chunks coming back from your API provider are just magically better.</p> <p class="wp-block-paragraph">If you want to change to a model from a new provider, just change a line or two of code to start getting improved responses (remember, commoditization). <strong>Think of the recent DeepSeek moment; what may be frightening for OpenAI is thrilling for application builders. </strong></p> <p class="wp-block-paragraph">It is important to note that the application layer is not without its challenges. I’ve noticed <a href="https://bsky.app/profile/thesaasreport.bsky.social/post/3lfv6qjmk5k2z" rel="noreferrer noopener" target="_blank">quite</a> <a href="https://x.com/ugamkamat/status/1755823325597814810" rel="noreferrer noopener" target="_blank">a</a> <a href="https://x.com/ugamkamat/status/1755823317603479944" rel="noreferrer noopener" target="_blank">bit</a> of hand wringing on social media about SaaS saturation. It can feel difficult to get users to register for an account, let alone pull out a credit card. It can feel as though you need VC funding for marketing blitzes and yet another in-vogue black-on-black marketing website. The app developer also has to be careful not to build something that will quickly be cannibalized by one of the big model providers. Think about how Perplexity initially built their fame by combining the power of LLMs with search capabilities. At the time this was novel; nowadays most popular chat applications have this functionality built-in.</p> <p class="wp-block-paragraph">Another hurdle for the application developer is obtaining <strong>domain expertise</strong>. Domain expertise is a fancy term for knowing about a niche field like law, medicine, automotive, etc. All of the technical skill in the world doesn’t mean much if the developer doesn’t have access to the necessary domain expertise to ensure their product actually helps someone. As a simple example, one can theorize how a document summarizer may help out a legal company, but without actually working closely with a lawyer, any usability remains theoretical. Use your network to become friends with some domain experts; they can help power your apps to success.</p> <p class="wp-block-paragraph">An alternative to partnering with a domain expert is building something specifically for yourself. If you enjoy the product, likely others will as well. You can then proceed to <a href="https://en.wikipedia.org/wiki/Eating_your_own_dog_food" rel="noreferrer noopener" target="_blank">dogfood</a> your app and iteratively improve it.</p> <h3 class="wp-block-heading" id="thick">Thick Wrappers</h3> <p class="wp-block-paragraph">Early applications with gen AI integration were derided as “thin wrappers” around language models. It’s true that taking an LLM and slapping a simple chat interface on it won’t succeed. You are essentially competing with ChatGPT, Claude, etc. in a race to the bottom. </p> <p class="wp-block-paragraph">The canonical thin wrapper looks something like:</p> <ul class="wp-block-list"> <li class="wp-block-list-item">A chat interface</li> <li class="wp-block-list-item">Basic prompt engineering</li> <li class="wp-block-list-item">A feature that likely will be cannibalized by one of the big model providers soon or can already be done using their apps</li> </ul> <p class="wp-block-paragraph">An example would be an “AI writing assistant” that just relays prompts to ChatGPT or Claude with basic prompt engineering. Another would be an “AI summarizer tool” that passes a text to an LLM to summarize, with no processing or domain-specific knowledge. </p> <p class="wp-block-paragraph">With our experience in developing web apps with AI integration, we at Los Angeles AI Apps have come up with the following criterion for how to avoid creating a thin wrapper application:</p> <blockquote class="wp-block-quote is-layout-flow wp-block-quote-is-layout-flow"> <p class="wp-block-paragraph">If the app can’t best ChatGPT with search by a significant factor, then it’s too thin.</p> </blockquote> <p class="wp-block-paragraph">A few things to note here, starting with the idea of a “significant factor”. Even if you are able to exceed ChatGPT’s capability in a particular domain by a small factor, it likely won’t be enough to ensure success. You really need to be a lot better than ChatGPT for people to even consider using the app. </p> <p class="wp-block-paragraph">Let me motivate this insight with an example. When I was learning data science, I created a <a href="https://towardsdatascience.com/how-to-build-a-rag-system-with-a-self-querying-retriever-in-langchain-16b4fa23e9ad/" target="_blank" rel="noreferrer noopener">movie recommendation project</a>. It was a great experience, and I learned quite a bit about RAG and web applications. </p> <figure class="wp-block-image size-large"><img decoding="async" src="https://contributor.insightmediagroup.io/wp-content/uploads/2025/04/film-search-1024x876.png" alt="film search" class="wp-image-601573"/><figcaption class="wp-element-caption">My old film recommendation app. Good times! Image by author.</figcaption></figure> <p class="wp-block-paragraph">Would it be a good production app? No. </p> <p class="wp-block-paragraph">No matter what question you ask it, ChatGPT will likely give you a movie recommendation that is comparable. Despite the fact that I was using RAG and pulling in a curated dataset of films, it is unlikely a user will find the responses much more compelling than ChatGPT + search. Since users are familiar with ChatGPT, they would likely stick with it for movie recommendations, even if the responses from my app were 2x or 3x better than ChatGPT (of course, defining “better” is tricky here.)</p> <p class="wp-block-paragraph">Let me use another example. One app we had considered building out was a web app for city government websites. These sites are notoriously large and hard to navigate. We thought if we could scrape the contents of the website domain and then use RAG we could craft a chatbot that would effectively answer user queries. It worked fairly well, <strong>but ChatGPT with search capabilities is a beast</strong>. It oftentimes matched or exceeded the performance of our bot. It would take extensive iteration on the RAG system to get our app to consistently beat ChatGPT + search. Even then, who would want to go to a new domain to get answers to city questions, when ChatGPT + search would yield similar results? Only by selling our services to the city government and having our chatbot integrated into the city website would we get consistent usage.</p> <p class="wp-block-paragraph">One way to differentiate yourself is via proprietary data. If there is private data that the model providers are not privy to, then that can be valuable. In this case the value is in the collection of the data, not the innovation of your chat interface or your RAG system. Consider a legal AI startup that provides its models with a large database of legal files that cannot be found on the open web. Perhaps RAG can be done to help the model answer legal questions over those private documents. Can something like this outdo ChatGPT + search? Yes, assuming the legal files cannot be found on Google. </p> <p class="wp-block-paragraph">Going even further, I believe the best way have your app stand out is to forego the chat interface entirely. Let me introduce two ideas:</p> <ul class="wp-block-list"> <li class="wp-block-list-item">Proactive AI</li> <li class="wp-block-list-item">Overnight AI</li> </ul> <h4 class="wp-block-heading" id="clippy">The Return of Clippy</h4> <p class="wp-block-paragraph">I read an <a href="https://evilmartians.com/chronicles/dont-just-slap-on-a-chatbot-building-ai-that-works-before-you-ask" rel="noreferrer noopener" target="_blank">excellent article</a> from the Evil Martians that highlights the innovation starting to occur at the application level. They describe how they have forgone a chat interface entirely, and instead are trying something they call <strong>proactive AI. </strong>Recall <a href="https://en.wikipedia.org/wiki/Office_Assistant" rel="noreferrer noopener" target="_blank">Clippy</a> from Microsoft Word. As you were typing out your document, it would butt in with suggestions. These were oftentimes not helpful, and poor Clippy was mocked. With the advent of LLMs, you can imagine making a much more powerful version of Clippy. It wouldn’t wait for a user to ask it a question, but instead could proactively gives users suggestions. This is similar to the coding Copilot that comes with VSCode. It doesn’t wait for the programmer to finish typing, but instead offers suggestions as they code. Done with care, this style of AI can reduce friction and improve user satisfaction.</p> <p class="wp-block-paragraph">Of course there are important considerations when creating proactive AI. You don’t want your AI pinging the user so often that they become frustrating. One can also imagine a dystopian future where LLMs are constantly nudging you to buy cheap junk or spend time on some mindless app without your prompting. Of course, machine learning models are already doing this, but putting human language on it can make it even more insidious and annoying. It is imperative that the developer ensures their application is used to benefit the user, not swindle or influence them.</p> <h4 class="wp-block-heading" id="sleep">Getting Stuff Done While You Sleep</h4> <figure class="wp-block-image size-full"><img decoding="async" src="https://contributor.insightmediagroup.io/wp-content/uploads/2025/04/overnight-AI.png" alt="Overnight AI" class="wp-image-601574"/><figcaption class="wp-element-caption">Image of AI working overnight. Image from GPT-4o</figcaption></figure> <p class="wp-block-paragraph">Another alternative to the chat interface is to use the LLMs offline rather than online. As an example, imagine you wanted to create a newsletter generator. This generator would use an automated scraper to pull in leads from a variety of sources. It would then create articles for leads it deems interesting. Each new issue of your newsletter would be kicked off by a background job, perhaps daily or weekly. <strong>The important detail here: there is no chat interface.</strong> There is no way for the user to have any input; they just get to enjoy the latest issue of the newsletter. Now we’re really starting to cook!</p> <p class="wp-block-paragraph">I call this <strong>overnight AI</strong>. The key is that the user never interacts with the AI at all. It just produces a summary, an explanation, an analysis etc. overnight while you are sleeping. In the morning, you wake up and get to enjoy the results. There should be no chat interface or suggestions in overnight AI. Of course, it can be very beneficial to have a human-in-the-loop. Imagine that the issue of your newsletter comes to you with proposed articles. You can either accept or reject the stories that go into your newsletter. Perhaps you can build in functionality to edit an article’s title, summary, or cover photo if you don’t like something the AI generated. </p> <h3 class="wp-block-heading">Summary</h3> <p class="wp-block-paragraph">In this article, I covered the basics behind the AI stack. This covered the infrastructure, data, model/orchestration, and application layers. I discussed why I believe the application layer is the best place to work, mainly due to the lack of commoditization, proximity to the end user, and opportunity to build products that benefit from work done in lower layers. We discussed how to prevent your application from being just another thin wrapper, as well as how to use AI in a way that avoids the chat interface entirely.</p> <p class="wp-block-paragraph">In part two, I will discuss why the best language to learn if you want to build web applications with AI integration is not Python, but Ruby. I will also break down why the microservices architecture for AI apps may not be the best way to build your apps, despite it being the default that most go with. </p> <p class="wp-block-paragraph"><img src="https://s.w.org/images/core/emoji/15.0.3/72x72/1f525.png" alt="🔥" class="wp-smiley" style="height: 1em; max-height: 1em;" /><em> If you’d like a custom web application with generative AI integration, visit </em><a href="https://losangelesaiapps.com/" target="_blank" rel="noreferrer noopener"><em>losangelesaiapps.com</em></a></p> <p>The post <a href="https://towardsdatascience.com/layers-ai-stack/">Layers of the AI Stack, Explained Simply</a> appeared first on <a href="https://towardsdatascience.com">Towards Data Science</a>.</p>Sesame Speech Model: How This Viral AI Model Generates Human-Like Speech
Sat, 12 Apr 2025 01:09:27 -0000
A deep dive into residual vector quantizers, conversational speech AI, and talkative transformers.
The post Sesame Speech Model: How This Viral AI Model Generates Human-Like Speech appeared first on Towards Data Science.
<p class="wp-block-paragraph"><mdspan datatext="el1744400684138" class="mdspan-comment">Recently, <strong>Sesame AI</strong></mdspan> published a demo of their latest Speech-to-Speech model. A conversational AI agent who is <em>really</em> good at speaking, they provide relevant answers, they speak with expressions, and honestly, they are just very fun and interactive to play with.</p> <p class="wp-block-paragraph"><em>Note that a technical paper is not out yet, but they do have a </em><a href="https://www.sesame.com/research/crossing_the_uncanny_valley_of_voice" target="_blank" rel="noreferrer noopener"><em>short blog post</em></a><em> that provides a lot of information about the techniques they used and previous algorithms they built upon.</em> </p> <p class="wp-block-paragraph">Thankfully, they provided enough information for me to write this article and make a <a href="https://youtu.be/ThG9EBbMhP8" target="_blank" rel="noreferrer noopener">YouTube video</a> out of it. Read on!</p> <h3 class="wp-block-heading">Training a Conversational Speech Model</h3> <p class="wp-block-paragraph">Sesame is a <strong>Conversational Speech Model</strong>, or a CSM. It inputs both text and audio, and generates speech as audio. While they haven’t revealed their training data sources in the articles, we can still try to take a solid guess. The <i>blog post</i> heavily cites another CSM, <a href="https://moshi.chat/" target="_blank" rel="noreferrer noopener">2024’s Moshi</a>, and fortunately, the creators of Moshi did reveal their data sources in their <a href="https://arxiv.org/abs/2410.00037" target="_blank" rel="noreferrer noopener">paper</a>. Moshi uses <em>7 million hours</em> of unsupervised speech data, <em>170 hours</em> of natural and scripted conversations (for multi-stream training), and <em>2000 more hours</em> of telephone conversations (The Fischer Dataset).<br></p> <hr class="wp-block-separator has-alpha-channel-opacity is-style-dotted"/> <figure class="wp-block-image size-large"><img decoding="async" src="https://contributor.insightmediagroup.io/wp-content/uploads/2025/04/Abstract-1024x1004.png" alt="" class="wp-image-601440"/><figcaption class="wp-element-caption">Sesame builds upon the <a href="https://arxiv.org/abs/2410.00037" target="_blank" rel="noreferrer noopener">Moshi Paper</a> (2024)</figcaption></figure> <h2 class="wp-block-heading">But what does it really take to generate audio?</h2> <p class="wp-block-paragraph"><strong>In raw form, audio is just a long sequence of amplitude values</strong> — a waveform. For example, if you’re sampling audio at 24 kHz, you are capturing 24,000 float values every second.</p> <figure class="wp-block-image size-large"><img decoding="async" src="https://contributor.insightmediagroup.io/wp-content/uploads/2025/04/7-1024x384.png" alt="" class="wp-image-601448"/><figcaption class="wp-element-caption">There are 24000 values here to represent 1 second of speech! (Image generated by author)</figcaption></figure> <p class="wp-block-paragraph"><strong>Of course, it is quite resource-intensive to process 24000 float values for just one second of data</strong>, especially because transformer computations scale quadratically with sequence length. It would be great if we could compress this signal and reduce the number of samples required to process the audio.</p> <p class="wp-block-paragraph">We will take a deep dive into the <strong>Mimi encoder</strong> and specifically <strong>Residual Vector Quantizers (RVQ)</strong>, which are the backbone of Audio/Speech modeling in <a href="https://towardsdatascience.com/tag/deep-learning/" title="Deep Learning">Deep Learning</a> today. We will end the article by learning about how Sesame generates audio using its special dual-transformer architecture.</p> <h3 class="wp-block-heading">Preprocessing audio</h3> <p class="wp-block-paragraph">Compression and feature extraction are where convolution helps us. Sesame uses the Mimi speech encoder to process audio. <strong>Mimi was introduced in the aforementioned </strong><a href="https://arxiv.org/pdf/2410.00037" target="_blank" rel="noreferrer noopener"><strong>Moshi paper</strong></a><strong> as well</strong>. Mimi is a self-supervised audio encoder-decoder model that converts audio waveforms into discrete “latent” tokens first, and then reconstructs the original signal. Sesame only uses the encoder section of Mimi to tokenize the input audio tokens. Let’s learn how.</p> <p class="wp-block-paragraph">Mimi inputs the raw speech waveform at 24Khz, passes them through several strided convolution layers to downsample the signal, with a stride factor of 4, 5, 6, 8, and 2. This means that the first CNN block downsamples the audio by 4x, then 5x, then 6x, and so on. In the end, it downsamples by a factor of 1920, reducing it to just 12.5 frames per second.</p> <p class="wp-block-paragraph">The convolution blocks also project the original float values to an embedding dimension of 512. Each embedding aggregates the local features of the original 1D waveform. 1 second of audio is now represented as around 12 vectors of size 512. This way, Mimi reduces the sequence length from 24000 to just 12 and converts them into dense continuous vectors.</p> <figure class="wp-block-image alignwide size-large"><img decoding="async" src="https://contributor.insightmediagroup.io/wp-content/uploads/2025/04/1-1024x176.png" alt="" class="wp-image-601441"/><figcaption class="wp-element-caption">Before applying any quantization, the Mimi Encoder downsamples the input 24KHz audio by 1920 times, and embeds it into 512 dimensions. In other words, you get 12.5 frames per second with each frame as a 512-dimensional vector. <a href="https://youtu.be/ThG9EBbMhP8" target="_blank" rel="noreferrer noopener">(Image from author’s video)</a></figcaption></figure> <h3 class="wp-block-heading">What is Audio Quantization?</h3> <p class="wp-block-paragraph">Given the continuous embeddings obtained after the convolution layer, we want to tokenize the input speech. <strong>If we can represent speech as a sequence of tokens, we can apply standard language learning transformers to train generative models.</strong></p> <p class="wp-block-paragraph">Mimi uses a <strong>Residual Vector Quantizer or RVQ tokenizer</strong> to achieve this. We will talk about the residual part soon, but first, let’s look at what a simple vanilla Vector quantizer does.</p> <h4 class="wp-block-heading">Vector Quantization</h4> <p class="wp-block-paragraph">The idea behind Vector Quantization is simple: you train a codebook , which is a collection of, say, 1000 random vector codes all of size 512 (same as your embedding dimension).</p> <figure class="wp-block-image alignwide size-large"><img decoding="async" src="https://contributor.insightmediagroup.io/wp-content/uploads/2025/04/2-1-1024x646.png" alt="" class="wp-image-601442"/><figcaption class="wp-element-caption">A Vanilla Vector Quantizer. A codebook of embeddings is trained. Given an input embedding, we map/quantize it to the nearest codebook entry. <a href="https://youtu.be/ThG9EBbMhP8" target="_blank" rel="noreferrer noopener">(Screenshot from author’s video)</a></figcaption></figure> <p class="wp-block-paragraph">Then, given the input vector, we will map it to the closest vector in our codebook — basically snapping a point to its nearest cluster center. This means we have effectively created a fixed vocabulary of tokens to represent each audio frame, because whatever the input frame embedding may be, we will represent it with the nearest cluster centroid. If you want to learn more about Vector Quantization, check out my video on this topic where I go much deeper with this.</p> <figure class="wp-block-embed is-type-video is-provider-youtube wp-block-embed-youtube wp-embed-aspect-16-9 wp-has-aspect-ratio"><div class="wp-block-embed__wrapper"> <iframe loading="lazy" title="If LLMs are text models, how do they generate images?" width="500" height="281" src="https://www.youtube.com/embed/EzDsrEvdgNQ?feature=oembed" frameborder="0" allow="accelerometer; autoplay; clipboard-write; encrypted-media; gyroscope; picture-in-picture; web-share" referrerpolicy="strict-origin-when-cross-origin" allowfullscreen></iframe> </div><figcaption class="wp-element-caption">More about Vector Quantization! (Video by author)</figcaption></figure> <h4 class="wp-block-heading">Residual Vector Quantization</h4> <p class="wp-block-paragraph">The problem with simple vector quantization is that the loss of information may be too high because we are mapping each vector to its cluster’s centroid. This <em>“snap”</em> is rarely perfect, so there is always an error between the original embedding and the nearest codebook.</p> <p class="wp-block-paragraph">The big idea of <a href="https://towardsdatascience.com/tag/residual-vector-quantization/" title="Residual Vector Quantization">Residual Vector Quantization</a> is that it doesn’t stop at having just one codebook. Instead, it tries to use multiple codebooks to represent the input vector.</p> <ol class="wp-block-list"> <li class="wp-block-list-item"><strong>First</strong>, you quantize the original vector using the first codebook.</li> <li class="wp-block-list-item"><strong>Then</strong>, you subtract that centroid from your original vector. What you’re left with is the <strong>residual</strong> — the error that wasn’t captured in the first quantization.</li> <li class="wp-block-list-item">Now take this residual, and <strong>quantize it again</strong>, using a <strong>second codebook full of brand new code vectors </strong>— again by snapping it to the nearest centroid.</li> <li class="wp-block-list-item">Subtract <em>that</em> too, and you get a smaller residual. Quantize again with a third codebook… and you can keep doing this for as many codebooks as you want.</li> </ol> <figure class="wp-block-image alignwide size-large"><img decoding="async" src="https://contributor.insightmediagroup.io/wp-content/uploads/2025/04/3-1-1024x485.png" alt="" class="wp-image-601443"/><figcaption class="wp-element-caption">Residual Vector Quantizers (RVQ) hierarchically encode the input embeddings by using a new codebook and VQ layer to represent the previous codebook’s error. (Illustration by the author)</figcaption></figure> <p class="wp-block-paragraph">Each step hierarchically captures a little more detail that was missed in the previous round. If you repeat this for, let’s say, N codebooks, you get a collection of N discrete tokens from each stage of quantization to represent one audio frame.</p> <p class="wp-block-paragraph">The coolest thing about RVQs is that they are designed to have a high inductive bias towards capturing the most essential content in the very first quantizer. In the subsequent quantizers, they learn more and more fine-grained features. </p> <p class="wp-block-paragraph">If you’re familiar with PCA, you can think of the first codebook as containing the primary principal components, capturing the most critical information. The subsequent codebooks represent higher-order components, containing information that adds more details.</p> <figure class="wp-block-image alignwide size-large"><img decoding="async" src="https://contributor.insightmediagroup.io/wp-content/uploads/2025/04/4-1-1024x424.png" alt="" class="wp-image-601444"/><figcaption class="wp-element-caption">Residual Vector Quantizers (RVQ) uses multiple codebooks to encode the input vector — one entry from each codebook. <a href="https://youtu.be/ThG9EBbMhP8" rel="noreferrer noopener" target="_blank">(Screenshot from author’s video)</a></figcaption></figure> <h4 class="wp-block-heading">Acoustic vs Semantic Codebooks</h4> <p class="wp-block-paragraph">Since Mimi is trained on the task of audio reconstruction, the encoder compresses the signal to the discretized latent space, and the decoder reconstructs it back from the latent space. When optimizing for this task, the RVQ codebooks learn to capture the essential acoustic content of the input audio inside the compressed latent space. </p> <p class="wp-block-paragraph">Mimi also separately trains a single codebook (vanilla VQ) that only focuses on embedding the semantic content of the audio. This is why <strong>Mimi is called a split-RVQ tokenizer</strong> – it divides the quantization process into two independent parallel paths: one for semantic information and another for acoustic information.</p> <figure class="wp-block-image alignwide size-large"><img decoding="async" src="https://contributor.insightmediagroup.io/wp-content/uploads/2025/04/5-1-1024x456.png" alt="" class="wp-image-601445"/><figcaption class="wp-element-caption">The Mimi Architecture (Source: Moshi paper) License: Free</figcaption></figure> <p class="wp-block-paragraph">To train semantic representations, Mimi used knowledge distillation with an existing speech model called WavLM as a semantic teacher. Basically, Mimi introduces an additional loss function that decreases the cosine distance between the semantic RVQ code and the WavLM-generated embedding.</p> <hr class="wp-block-separator has-alpha-channel-opacity is-style-dotted"/> <h2 class="wp-block-heading">Audio Decoder</h2> <p class="wp-block-paragraph">Given a conversation containing text and audio, we first convert them into a sequence of token embeddings using the text and audio tokenizers. This token sequence is then input into a transformer model as a time series. In the blog post, this model is referred to as the Autoregressive Backbone Transformer. Its task is to process this time series and output the “zeroth” codebook token.</p> <p class="wp-block-paragraph">A lighterweight transformer called the audio decoder then reconstructs the next codebook tokens conditioned on this zeroth code generated by the backbone transformer. Note that the zeroth code already contains a lot of information about the history of the conversation since the backbone transformer has visibility of the entire past sequence. <strong>The lightweight audio decoder only operates on the zeroth token and generates the other N-1</strong> codes. These codes are generated by using N-1 distinct linear layers that output the probability of choosing each code from their corresponding codebooks. </p> <p class="wp-block-paragraph">You can imagine this process as predicting a text token from the vocabulary in a text-only LLM. Just that a text-based LLM has a single vocabulary, but the RVQ-tokenizer has multiple vocabularies in the form of the N codebooks, so you need to train a separate linear layer to model the codes for each.</p> <figure class="wp-block-image size-large"><img decoding="async" src="https://contributor.insightmediagroup.io/wp-content/uploads/2025/04/8-1024x576.jpg" alt="" class="wp-image-601537"/><figcaption class="wp-element-caption">The Sesame Architecture (Illustration by the author)</figcaption></figure> <p class="wp-block-paragraph">Finally, after the codewords are all generated, we aggregate them to form the combined continuous audio embedding. The final job is to convert this audio back to a waveform. For this, we apply transposed convolutional layers to upscale the embedding back from 12.5 Hz back to KHz waveform audio. Basically, reversing the transforms we had applied originally during audio preprocessing.</p> <h3 class="wp-block-heading">In Summary</h3> <figure class="wp-block-embed is-type-video is-provider-youtube wp-block-embed-youtube wp-embed-aspect-16-9 wp-has-aspect-ratio"><div class="wp-block-embed__wrapper"> <iframe loading="lazy" title="Sesame AI and RVQs - the network architecture behind VIRAL speech models" width="500" height="281" src="https://www.youtube.com/embed/ThG9EBbMhP8?feature=oembed" frameborder="0" allow="accelerometer; autoplay; clipboard-write; encrypted-media; gyroscope; picture-in-picture; web-share" referrerpolicy="strict-origin-when-cross-origin" allowfullscreen></iframe> </div><figcaption class="wp-element-caption">Check out the accompanying video on this article! (Video by author)</figcaption></figure> <p class="wp-block-paragraph">So, here is the overall summary of the Sesame model in some bullet points.</p> <ol class="wp-block-list"> <li class="wp-block-list-item"> Sesame is built on a multimodal Conversation Speech Model or a CSM.</li> <li class="wp-block-list-item">Text and audio are tokenized together to form a sequence of tokens and input into the backbone transformer that autoregressively processes the sequence.</li> <li class="wp-block-list-item">While the text is processed like any other text-based LLM, the audio is processed directly from its waveform representation. They use the Mimi encoder to convert the waveform into latent codes using a split RVQ tokenizer.</li> <li class="wp-block-list-item">The multimodal backbone transformers consume a sequence of tokens and predict the next zeroth codeword.</li> <li class="wp-block-list-item"> Another lightweight transformer called the Audio Decoder predicts the next codewords from the zeroth codeword.</li> <li class="wp-block-list-item">The final audio frame representation is generated from combining all the generated codewords and upsampled back to the waveform representation.</li> </ol> <p class="wp-block-paragraph">Thanks for reading!</p> <h3 class="wp-block-heading">References and Must-read papers</h3> <p class="wp-block-paragraph"><strong><a href="https://www.youtube.com/@avb_fj">Check out my ML YouTube Channel</a></strong></p> <p class="wp-block-paragraph"><strong><a href="https://www.sesame.com/research/crossing_the_uncanny_valley_of_voice">Sesame Blogpost and Demo</a></strong></p> <p class="wp-block-paragraph"><strong>Relevant papers: <br></strong>Moshi: <a href="https://arxiv.org/abs/2410.00037" rel="noreferrer noopener" target="_blank">https://arxiv.org/abs/2410.00037</a> <br>SoundStream: <a href="https://arxiv.org/abs/2107.03312" rel="noreferrer noopener" target="_blank">https://arxiv.org/abs/2107.03312</a> <br>HuBert: <a href="https://arxiv.org/abs/2106.07447" rel="noreferrer noopener" target="_blank">https://arxiv.org/abs/2106.07447</a> <br>Speech Tokenizer: <a href="https://arxiv.org/abs/2308.16692" rel="noreferrer noopener" target="_blank">https://arxiv.org/abs/2308.16692</a></p> <hr class="wp-block-separator has-alpha-channel-opacity"/> <p>The post <a href="https://towardsdatascience.com/sesame-speech-model-how-this-viral-ai-model-generates-human-like-speech/">Sesame Speech Model: How This Viral AI Model Generates Human-Like Speech</a> appeared first on <a href="https://towardsdatascience.com">Towards Data Science</a>.</p>Agentic AI for the Whole SLDC With Atlassian Rovo Dev Agents
Fri, 18 Apr 2025 21:00:20 -0000

ANAHEIM, CALIF. — So much of generative AI (GenAI) for engineers is focused on the inner loop, especially AI-generated code.
The post Agentic AI for the Whole SLDC With Atlassian Rovo Dev Agents appeared first on The New Stack.
Now in public beta, Atlassian Rovo dev agents integrate agentic AI across the software development lifecycle.CTO Insights: 4 Key Lessons for a Digital-First Business Future
Fri, 18 Apr 2025 18:00:16 -0000

Five years ago, the COVID pandemic forced businesses to make massive changes in their operations wholesale. IT spending surged to
The post CTO Insights: 4 Key Lessons for a Digital-First Business Future appeared first on The New Stack.
To succeed in this new era, tech leaders must learn from four key lessons that the pandemic-driven digital rush taught us.NVIDIA GTC 2025 Wrap-Up: 18 New Products to Watch
Fri, 18 Apr 2025 18:00:00 -0000

If you follow the tech news, you have read a lot about NVIDIA and its graphics processing units (GPUs). However,
The post NVIDIA GTC 2025 Wrap-Up: 18 New Products to Watch appeared first on The New Stack.
A comprehensive summary of the major compute, networking, storage and partnership announcements from NVIDIA’s biggest event of the year.Agentic IDEs: Next Frontier in Intelligent Coding
Fri, 18 Apr 2025 17:00:22 -0000

Especially in the last couple of years, integrated development environments (IDEs) have come a long way from their humble beginnings
The post Agentic IDEs: Next Frontier in Intelligent Coding appeared first on The New Stack.
How AI-powered development environments are evolving from assistants to autonomous collaborators, reshaping the future of software creation.Why a Culture of Observability Is Key to Technology Success
Fri, 18 Apr 2025 16:00:58 -0000

For Ashley, the director of observability at a multinational electronics manufacturer, a lack of buy-in and understanding about observability within
The post Why a Culture of Observability Is Key to Technology Success appeared first on The New Stack.
A strong culture of observability can be the difference between resolving an issue swiftly or allowing it to escalate into a larger, more costly problem.EU OS: A European Proposal for a Public Sector Linux Desktop
Fri, 18 Apr 2025 15:00:48 -0000

There have been thousands of Linux distributions, and at my best estimate, there are still over 250 distros being updated
The post EU OS: A European Proposal for a Public Sector Linux Desktop appeared first on The New Stack.
There are many Linux distributions, but now there's a proposal for one that's specific to the European Union government and nongovernmental organizations.Valkey Bloom Filter Detects Fraud (While Not Breaking the Bank)
Fri, 18 Apr 2025 14:00:09 -0000

Just in time for spring (if you live in the Northern Hemisphere), the Valkey open source key-value datastore now supports
The post Valkey Bloom Filter Detects Fraud (While Not Breaking the Bank) appeared first on The New Stack.
The new data type for efficient probabilistic membership testing is for use cases like fraud detection and ad deduplication with significant memory savings.Tutorial: GPU-Accelerated Serverless Inference With Google Cloud Run
Fri, 18 Apr 2025 13:00:21 -0000

Recently, Google Cloud launched GPU support for the Cloud Run serverless platform. This feature enables developers to accelerate serverless inference
The post Tutorial: GPU-Accelerated Serverless Inference With Google Cloud Run appeared first on The New Stack.
In this tutorial, I will walk you through the steps of deploying Llama 3.1 LLM with 8B parameters on a GPU-based Cloud Run service.Introduction to DevOps
Fri, 18 Apr 2025 12:00:45 -0000

What Is DevOps? DevOps stands as a transformative approach in the world of software development, merging the practices of development
The post Introduction to DevOps appeared first on The New Stack.
DevOps stands as a transformative approach in the world of software development, merging the practices of development (Dev) and operations (Ops). Learn more!How To Read a Traceroute for Network Troubleshooting
Thu, 17 Apr 2025 21:00:16 -0000

The traceroute tool is one of the most valuable yet straightforward diagnostic utilities available for network troubleshooting. Built into virtually
The post How To Read a Traceroute for Network Troubleshooting appeared first on The New Stack.
Learn how to run a traceroute command, interpret the results and understand the common problems that it reveals.How To Build Scalable and Reliable CI/CD Pipelines With Kubernetes
Thu, 17 Apr 2025 18:00:42 -0000

In today’s fast-paced software development landscape, Continuous Integration and Continuous Deployment (CI/CD) have become essential practices for delivering high-quality applications
The post How To Build Scalable and Reliable CI/CD Pipelines With Kubernetes appeared first on The New Stack.
By integrating CI/CD pipelines with Kubernetes, organizations can deploy applications in a scalable, consistent, and resilient manner.Kelsey Hightower, AWS’s Eswar Bala on Open Source’s Evolution
Thu, 17 Apr 2025 17:00:21 -0000

There’s always been tension between the worlds of enterprise and open source software. It’s not every day that those tensions
The post Kelsey Hightower, AWS’s Eswar Bala on Open Source’s Evolution appeared first on The New Stack.
What does it mean when AWS and Google start building open source projects? Learn more in this episode of The New Stack Makers, from KubeCon Europe.Real-Time Read-Heavy Database Workloads: Considerations and Tips
Thu, 17 Apr 2025 16:00:22 -0000

Reading and writing are distinctly different beasts. This is true with reading and writing words, reading and writing code, and
The post Real-Time Read-Heavy Database Workloads: Considerations and Tips appeared first on The New Stack.
Explore the latency and other challenges teams face with real-time read-heavy databases and some best practices for handling them.MongoDB Finds AI Can Help With Legacy System Migration
Thu, 17 Apr 2025 15:00:56 -0000

“We’re using LLMs and AI to fully modernize old applications,” said Scott Sanchez, ‘s product marketing and strategy leader, in
The post MongoDB Finds AI Can Help With Legacy System Migration appeared first on The New Stack.
MongoDB says that with these tools, companies can save money, run things more efficiently and make better architectural decisions.Optimizing the 90%: Where Dev Time Really Gets Stuck
Thu, 17 Apr 2025 14:00:06 -0000

So much focus is placed on the new code your developers write: How can you use AI to speed it
The post Optimizing the 90%: Where Dev Time Really Gets Stuck appeared first on The New Stack.
Only 10% of a developer’s time is spent writing new code, so focus your efforts on reducing bottlenecks elsewhere.GitLab’s Duo Assistant With Amazon Q Is Now Generally Available
Thu, 17 Apr 2025 13:00:38 -0000

Back at AWS re:Invent 2024, Amazon Web Services (AWS) and announced a deep integration between GitLab’s Duo AI assistant and
The post GitLab’s Duo Assistant With Amazon Q Is Now Generally Available appeared first on The New Stack.
The mashup allows developers on GitLab to access Q agents for help with code reviews, test generation and more, all without having to switch context.Math-Phobic Coders, Rejoice: Python Does the Hard Work
Thu, 17 Apr 2025 00:00:06 -0000

Why math? It’s a great question. I remember the last algebra class I took (definitely not a math person). Every
The post Math-Phobic Coders, Rejoice: Python Does the Hard Work appeared first on The New Stack.
Unlock the power of Python's built-in math module to handle complex calculations across industries without needing to be a math genius yourself.Sampling vs. Resampling With Python: Key Differences and Applications
Wed, 16 Apr 2025 23:00:25 -0000

Have you ever watched or listened to the news during election times and heard mention of sampling or sample size
The post Sampling vs. Resampling With Python: Key Differences and Applications appeared first on The New Stack.
Learn the key differences between sampling and resampling in data science with real-world examples, Python code and best practices.Why Most IaC Strategies Still Fail — And How To Fix Them
Wed, 16 Apr 2025 22:00:14 -0000

Infrastructure as Code (IaC) was supposed to solve the chaos of cloud operations. It promised visibility, governance and the ability
The post Why Most IaC Strategies Still Fail — And How To Fix Them appeared first on The New Stack.
Infrastructure as Code offers a compelling vision for solving the chaos of cloud ops, but in practice many organizations remain tangled in complexity.Build a Real-Time Bidding System With Next.js and Stream
Wed, 16 Apr 2025 21:00:52 -0000

Real-time applications are becoming more vital than ever in today’s digital world, providing users with instant updates and interactive experiences.
The post Build a Real-Time Bidding System With Next.js and Stream appeared first on The New Stack.
Stream’s React Chat SDK with the JavaScript client will help us build a bidding app with support for rich messages, image uploads, videos and more.Why IT Belongs at the Edge
Wed, 16 Apr 2025 20:00:33 -0000

Traditionally, edge computing has largely been the responsibility of operational technology (OT) teams. But as edge deployments increase in number
The post Why IT Belongs at the Edge appeared first on The New Stack.
Virtual machines and containers — and IT and OT — are better together when extending cloud native capabilities to edge environments.Move Beyond Chatbots, Plus 5 Other Lessons for AI Developers
Wed, 16 Apr 2025 19:00:19 -0000

The New Stack previously shared a case study from Fractional AI‘s work building an AI agent, AI Assistant, to automate
The post Move Beyond Chatbots, Plus 5 Other Lessons for AI Developers appeared first on The New Stack.
Fractional AI shares how hallucinations can be managed and other key takeaways for developers using AI to automate workflows.Vibing Dangerously: The Hidden Risks of AI-Generated Code
Wed, 16 Apr 2025 18:00:21 -0000

Vibe coding has rapidly emerged as a revolutionary approach to software development. This methodology relies on large language models (LLMs)
The post Vibing Dangerously: The Hidden Risks of AI-Generated Code appeared first on The New Stack.
Vibe coding revolutionizes development speed, but security experts warn of potentially dangerous vulnerabilities lurking beneath AI-generated code.Harness Kubernetes Costs With OpenCost
Wed, 16 Apr 2025 17:00:08 -0000

The major conversations (read: complaints) at every event I attend are about managing Kubernetes’ complexity and cost. A recent survey
The post Harness Kubernetes Costs With OpenCost appeared first on The New Stack.
Kubernetes complexity and cost are growing issues, but Korifi and OpenCost provide open source solutions.Slopsquatting: The Newest Threat to Your AI-Generated Code
Wed, 16 Apr 2025 16:00:10 -0000

Software developers are increasingly using AI to create code, a trend that’s not surprising given the increasing demands put on
The post Slopsquatting: The Newest Threat to Your AI-Generated Code appeared first on The New Stack.
As AI code generation booms, new research reveals how "slopsquatting" exploits hallucinated package names, creating hidden security risks even experienced developers might miss.AI at the Edge: Federated Learning for Greater Performance
Wed, 16 Apr 2025 15:00:53 -0000

The classical machine learning paradigm requires the aggregation of user data in a central location where data scientists can pre-process
The post AI at the Edge: Federated Learning for Greater Performance appeared first on The New Stack.
Federated learning, introduced by Google nearly a decade ago, can offer stronger data privacy and a greener way to train models for use at the edge.Engineering Manager
Mon, 24 Feb 2025 17:00:00 -0000
Distributed tracing is a critical part of an observability stack, letting you troubleshoot latency and errors in your applications. Cloud Trace, part of Google Cloud Observability, is Google Cloud’s native tracing product, and we’ve made numerous improvements to the Trace explorer UI on top of a new analytics backend.

The new Trace explorer page contains:
-
A filter bar with options for users to choose a Google Cloud project-based trace scope, all/root spans and a custom attribute filter.
-
A faceted span filter pane that displays commonly used filters based on OpenTelemetry conventions.
-
A visualization of matching spans including an interactive span duration heatmap (default), a span rate line chart, and a span duration percentile chart.
-
A table of matching spans that can be narrowed down further by selecting a cell of interest on the heatmap.
A tour of the new Trace explorer
Let’s take a closer look at these new features and how you can use them to troubleshoot your applications. Imagine you’re a developer working on the checkoutservice of a retail webstore application and you’ve been paged because there’s an ongoing incident.
- aside_block
- <ListValue: [StructValue([('title', 'Try Google Cloud for free'), ('body', <wagtail.rich_text.RichText object at 0x3e60eeda5280>), ('btn_text', 'Get started for free'), ('href', 'https://console.cloud.google.com/freetrial?redirectPath=/welcome'), ('image', None)])]>
This application is instrumented using OpenTelemetry and sends trace data to Google Cloud Trace, so you navigate to the Trace explorer page on the Google Cloud console with the context set to the Google Cloud project that hosts the checkoutservice.
Before starting your investigation, you remember that your admin recommended using the webstore-prod trace scope when investigating webstore app-wide prod issues. By using this Trace scope, you'll be able to see spans stored in other Google Cloud projects that are relevant to your investigation.

You set the trace scope to webstore-prod and your queries will now include spans from all the projects included in this trace scope.

You select checkoutservice in Span filters (1) and the following updates load on the page:
-
Other sections such as Span name in the span filter pane (2) are updated with counts and percentages that take into account the selection made under service name. This can help you narrow down your search criteria to be more specific.
-
The span Filter bar (3) is updated to display the active filter.
-
The heatmap visualization (4) is updated to only display spans from the checkoutservice in the last 1 hour (default). You can change the time-range using the time-picker (5). The heatmap’s x-axis is time and the y-axis is span duration. It uses color shades to denote the number of spans in each cell with a legend that indicates the corresponding range.
-
The Spans table (6) is updated with matching spans sorted by duration (default).
-
Other Chart views (7) that you can switch to are also updated with the applied filter.
From looking at the heatmap, you can see that there are some spans in the >100s range which is abnormal and concerning. But first, you’re curious about the traffic and corresponding latency of calls handled by the checkoutservice.

Switching to the Span rate line chart gives you an idea of the traffic handled by your service. The x-axis is time and the y-axis is spans/second. The traffic handled by your service looks normal as you know from past experience that 1.5-2 spans/second is quite typical.

Switching to the Span duration percentile chart gives you p50/p90/p95/p99 span duration trends. While p50 looks fine, the p9x durations are greater than you expect for your service.

You switch back to the heatmap chart and select one of the outlier cells to investigate further. This particular cell has two matching spans with a duration of over 2 minutes, which is concerning.

You investigate one of those spans by viewing the full trace and notice that the orders publish span is the one taking up the majority of the time when servicing this request. Given this, you form a hypothesis that the checkoutservice is having issues handling these types of calls. To validate your hypothesis, you note the rpc.method attribute being PlaceOrder and exit this trace using the X button.

You add an attribute filter for key: rpc.method value:PlaceOrder using the Filter bar, which shows you that there is a clear latency issue with PlaceOrder calls handled by your service. You’ve seen this issue before and know that there is a runbook that addresses it, so you alert the SRE team with the appropriate action that needs to be taken to mitigate the incident.

Share your feedback with us via the Send feedback button.
Behind the scenes

This new experience is powered by BigQuery, using the same platform that backs Log Analytics. We plan to launch new features that take full advantage of this platform: SQL queries, flexible sampling, export, and regional storage.
In summary, you can use the new Cloud Trace explorer to perform service-oriented investigations with advanced querying and visualization of trace data. This allows developers and SREs to effectively troubleshoot production incidents and identify mitigating measures to restore normal operations.
The new Cloud Trace explorer is generally available to all users — try it out and share your feedback with us via the Send feedback button.
-
Technical Program Manager, Google
Thu, 20 Feb 2025 17:00:00 -0000
Picture this: you’re an Site Reliability Engineer (SRE) responsible for the systems that power your company’s machine learning (ML) services. What do you do to ensure you have a reliable ML service, how do you know you’re doing it well, and how can you build strong systems to support these services?
As artificial intelligence (AI) becomes more widely available, its features — including ML — will matter more to SREs. That’s because ML becomes both a part of the infrastructure used in production software systems, as well as an important feature of the software itself.
Abstractly, machine learning relies on its pipelines … and you know how to manage those! So you can begin with pipeline management, then look to other factors that will strengthen your ML services: training, model freshness, and efficiency. In the resources below, we'll look at some of the ML-specific characteristics of these pipelines that you’ll want to consider in your operations. Then, we draw on the experience of Google SREs to show you how to apply your core SRE skills to operating and managing your organization’s machine-learning pipelines.
Training ML models
Training ML models applies the notion of pipelines to specific types of data, often running on specialized hardware. Critical aspects to consider about the pipeline:
-
how much data you’re ingesting
-
how fresh this data needs to be
-
how the system trains and deploys the models
-
how efficiently the system handles these first three things
This keynote presents an SRE perspective on the value of applying reliability principles to the components of machine learning systems. It provides insight into why ML systems matter for products, and how SREs should think about them. The challenges that ML systems present include capacity planning, resource management, and monitoring; other challenges include understanding the cost of ML systems as part of your overall operations environment.
- aside_block
- <ListValue: [StructValue([('title', 'Try Google Cloud for free'), ('body', <wagtail.rich_text.RichText object at 0x3e60ef9f73d0>), ('btn_text', 'Get started for free'), ('href', 'https://console.cloud.google.com/freetrial?redirectPath=/welcome'), ('image', None)])]>
ML freshness and data volume
As with any pipeline-based system, a big part of understanding the system is describing how much data it typically ingests and processes. The Data Processing Pipelines chapter in the SRE Workbook lays out the fundamentals: automate the pipeline’s operation so that it is resilient, and can operate unattended.
You’ll want to develop Service Level Objectives (SLOs) in order to measure the pipeline’s health, especially for data freshness, i.e., how recently the model got the data it’s using to produce an inference for a customer. Understanding freshness provides an important measure of an ML system’s health, as data that becomes stale may lead to lower-quality inferences and sub-optimal outcomes for the user. For some systems, such as weather forecasting, data may need to be very fresh (just minutes or seconds old); for other systems, such as spell-checkers, data freshness can lag on the order of days — or longer! Freshness requirements will vary by product, so it’s important that you know what you’re building and how the audience expects to use it.
In this way, freshness is a part of the critical user journey described in the SRE Workbook, describing one aspect of the customer experience. You can read more about data freshness as a component of pipeline systems in the Google SRE article Reliable Data Processing with Minimal Toil.
There’s more than freshness to ensuring high-quality data — there’s also how you define the model-training pipeline. A Brief Guide To Running ML Systems in Production gives you the nuts and bolts of this discipline, from using contextual metrics to understand freshness and throughput, to methods for understanding the quality of your input data.
Serving efficiency
The 2021 SRE blog post Efficient Machine Learning Inference provides a valuable resource to learn about improving your model’s performance in a production environment. (And remember, training is never the same as production for ML services!)
Optimizing machine learning inference serving is crucial for real-world deployment. In this article, the authors explore multi-model serving off of a shared VM. They cover realistic use cases and how to manage trade-offs between cost, utilization, and latency of model responses. By changing the allocation of models to VMs, and varying the size and shape of those VMs in terms of processing, GPU, and RAM attached, you can improve the cost effectiveness of model serving.
Cost efficiency
We mentioned that these AI pipelines often rely on specialized hardware. How do you know you’re using this hardware efficiently? Todd Underwood’s talk from SREcon EMEA 2023 on Artificial Intelligence: What Will It Cost You? gives you a sense of how much this specialized hardware costs to run, and how you can provide incentives for using it efficiently.
Automation for scale
This article from Google's SRE team outlines strategies for ensuring reliable data processing while minimizing manual effort, or toil. One of the key takeaways: use an existing, standard platform for as much of the pipeline as possible. After all, your business goals should focus on innovations in presenting the data and the ML model, not in the pipeline itself. The article covers automation, monitoring, and incident response, with a focus on using these concepts to build resilient data pipelines. You’ll read best practices for designing data systems that can handle failures gracefully and reduce a team’s operational burden. This article is essential reading for anyone involved in data engineering or operations. Read more about toil in the SRE Workbook: https://sre.google/workbook/eliminating-toil/.
Next steps
Successful ML deployments require careful management and monitoring for systems to be reliable and sustainable. That means taking a holistic approach, including implementing data pipelines, training pathways, model management, and validation, alongside monitoring and accuracy metrics. To go deeper, check out this guide on how to use GKE for your AI orchestration.
-
Cross-Product Solution Developer
Fri, 14 Feb 2025 17:00:00 -0000
In today's dynamic digital landscape, building and operating secure, reliable, cost-efficient and high-performing cloud solutions is no easy feat. Enterprises grapple with the complexities of cloud adoption, and often struggle to bridge the gap between business needs, technical implementation, and operational readiness. This is where the Google Cloud Well-Architected Framework comes in. The framework provides comprehensive guidance to help you design, develop, deploy, and operate efficient, secure, resilient, high-performing, and cost-effective Google Cloud topologies that support your security and compliance requirements.
Who should use the Well-Architected Framework?
The Well-Architected Framework caters to a broad spectrum of cloud professionals. Cloud architects, developers, IT administrators, decision makers and other practitioners can benefit from years of subject-matter expertise and knowledge both from within Google and from the industry. The framework distills this vast expertise and presents it as an easy-to-consume set of recommendations.
The recommendations in the Well-Architected Framework are organized under five, business-focused pillars.

We recently completed a revamp of the guidance in all the pillars and perspectives of the Well-Architected Framework to center the recommendations around a core set of design principles.
In addition to the above pillars, the Well-Architected Framework provides cross-pillar perspectives that present recommendations for selected domains, industries, and technologies like AI and machine learning (ML).
- aside_block
- <ListValue: [StructValue([('title', 'Try Google Cloud for free'), ('body', <wagtail.rich_text.RichText object at 0x3e60efc9d340>), ('btn_text', 'Get started for free'), ('href', 'https://console.cloud.google.com/freetrial?redirectPath=/welcome'), ('image', None)])]>
Benefits of adopting the Well-Architected Framework
The Well-Architected Framework is much more than a collection of design and operational recommendations. The framework empowers you with a structured principles-oriented design methodology that unlocks many advantages:
-
Enhanced security, privacy, and compliance: Security is paramount in the cloud. The Well-Architected Framework incorporates industry-leading security practices, helping ensure that your cloud architecture meets your security, privacy, and compliance requirements.
-
Optimized cost: The Well-Architected Framework lets you build and operate cost-efficient cloud solutions by promoting a cost-aware culture, focusing on resource optimization, and leveraging built-in cost-saving features in Google Cloud.
-
Resilience, scalability, and flexibility: As your business needs evolve, the Well-Architected Framework helps you design cloud deployments that can scale to accommodate changing demands, remain highly available, and be resilient to disasters and failures.
-
Operational excellence: The Well-Architected Framework promotes operationally sound architectures that are easy to operate, monitor, and maintain.
-
Predictable and workload-specific performance: The Well-Architected Framework offers guidance to help you build, deploy, and operate workloads that provide predictable performance based on your workloads’ needs.
-
The Well-Architected Framework also includes cross-pillar perspectives for selected domains, industries, and technologies like AI and machine learning (ML).
The principles and recommendations in the Google Cloud Well-Architected Framework are aligned with Google and industry best practices like Google’s Site Reliability Engineering (SRE) practices, DORA capabilities, the Google HEART framework for user-centered metrics, the FinOps framework, Supply-chain Levels for Software Artifacts (SLSA), and Google's Secure AI Framework (SAIF).
Embrace the Well-Architected Framework to transform your Google Cloud journey, and get comprehensive guidance on security, reliability, cost, performance, and operations — as well as targeted recommendations for specific industries and domains like AI and ML. To learn more, visit Google Cloud Well-Architected Framework.
Product Manager
Thu, 30 Jan 2025 20:00:00 -0000
We are thrilled to announce the collaboration between Google Cloud, AWS, and Azure on Kube Resource Orchestrator, or kro (pronounced “crow”). kro introduces a Kubernetes-native, cloud-agnostic way to define groupings of Kubernetes resources. With kro, you can group your applications and their dependencies as a single resource that can be easily consumed by end users.
Challenges of Kubernetes resource orchestration
Platform and DevOps teams want to define standards for how application teams deploy their workloads, and they want to use Kubernetes as the platform for creating and enforcing these standards. Each service needs to handle everything from resource creation to security configurations, monitoring setup, defining the end-user interface, and more. There are client-side templating tools that can help with this (e.g., Helm, Kustomize), but Kubernetes lacks a native way for platform teams to create custom groupings of resources for consumption by end users.
Before kro, platform teams needed to invest in custom solutions such as building custom Kubernetes controllers, or using packaging tools like Helm, which can’t leverage the benefits of Kubernetes CRDs. These approaches are costly to build, maintain, and troubleshoot, and complex for non-Kubernetes experts to consume. This is a problem many Kubernetes users face. Rather than developing vendor-specific solutions, we’ve partnered with Amazon and Microsoft on making K8s APIs simpler for all Kubernetes users.
- aside_block
- <ListValue: [StructValue([('title', '$300 in free credit to try Google Cloud containers and Kubernetes'), ('body', <wagtail.rich_text.RichText object at 0x3e60ee1300d0>), ('btn_text', 'Start building for free'), ('href', 'http://console.cloud.google.com/freetrial?redirectpath=/marketplace/product/google/container.googleapis.com'), ('image', None)])]>
How kro simplifies the developer experience
kro is a Kubernetes-native framework that lets you create reusable APIs to deploy multiple resources as a single unit. You can use it to encapsulate a Kubernetes deployment and its dependencies into a single API that your application teams can use, even if they aren’t familiar with Kubernetes. You can use kro to create custom end-user interfaces that expose only the parameters an end user should see, hiding the complexity of Kubernetes and cloud-provider APIs.
kro does this by introducing the concept of a ResourceGraphDefinition, which specifies how a standard Kubernetes Custom Resource Definition (CRD) should be expanded into a set of Kubernetes resources. End users define a single resource, which kro then expands into the custom resources defined in the CRD.
kro can be used to group and manage any Kubernetes resources. Tools like ACK, KCC, or ASO define CRDs to manage cloud provider resources from Kubernetes (these tools enable cloud provider resources, like storage buckets, to be created and managed as Kubernetes resources). kro can also be used to group resources from these tools, along with any other Kubernetes resources, to define an entire application deployment and the cloud provider resources it depends on.

Example use cases
Below, you’ll find some examples of kro being used with Google Cloud. You can find additional examples on the kro website.
Example 1: GKE cluster definition
Imagine that a platform administrator wants to give end users in their organization self-service access to create GKE clusters. The platform administrator creates a kro ResourceGraphDefinition called GKEclusterRGD that defines the required Kubernetes resources and a CRD called GKEcluster that exposes only the options they want to be configurable by end users. In addition to creating a cluster, the platform team also wants clusters to deploy administrative workloads such as policies, agents, etc. The ResourceGraphDefinition defines the following resources, using KCC to provide the mappings from K8s CRDs to Google Cloud APIs:
-
GKE cluster, Container Node Pools, IAM ServiceAccount, IAM PolicyMember, Services, Policies
The platform administrator would then define the end-user interface so that they can create a new cluster by creating an instance of the CRD that defines:
-
Cluster name, Nodepool name, Max nodes, Location (e.g. us-east1), Networks (optional)
Everything related to policy, service accounts, and service activation (and how these resources relate to each other) is hidden from the end user, simplifying their experience.

Example 2: Web application definition
In this example, a DevOps Engineer wants to create a reusable definition of a web application and its dependencies. They create a ResourceGraphDefinition called WebAppRGD, which defines a new Kubernetes CRD called WebApp. This new resource encapsulates all the necessary resources for a web application environment, including:
-
Deployments, service, service accounts, monitoring agents, and cloud resources like object storage buckets.
The WebAppRGD ResourceGraphDefinition can set a default configuration, and also define which parameters can be set by the end user at deployment time (kro gives you the flexibility to decide what is immutable, and what an end user is able to configure). A developer then creates an instance of the WebApp CRD, inputting any user-facing parameters. kro then deploys the desired Kubernetes resource.

Key benefits of kro
We believe kro is a big step forward for platform engineering teams, delivering a number of advantages:
-
Kubernetes-native: kro leverages Kubernetes Custom Resource Definitions (CRDs) to extend Kubernetes, so it works with any Kubernetes resource and integrates with existing Kubernetes tools and workflows.
-
Lets you create a simplified end user experience: kro makes it easy to define end-user interfaces for complex groups of Kubernetes resources, making it easy for people who are not Kubernetes experts to consume services built on Kubernetes.
-
Enables standardized services for application teams: kro templates can be reused across different projects and environments, promoting consistency and reducing duplication of effort.
Get started with kro
kro is available as an open-source project on GitHub. The GitHub organization is currently jointly owned by teams from Google, AWS, and Microsoft, and we welcome contributions from the community. We also have a website with documentation on installing and using kro, including example use cases. As an early-stage project, kro is not yet ready for production use, but we still encourage you to test it out in your own Kubernetes development environments!
Senior Product Manager, Google
Thu, 23 Jan 2025 17:00:00 -0000
Platform engineering, one of Gartner’s top 10 strategic technology trends for 2024, is rapidly becoming indispensable for enterprises seeking to accelerate software delivery and improve developer productivity. How does it do that? Platform engineering is about providing the right infrastructure, tools, and processes that enable efficient, scalable software development, deployment, and management, all while minimizing the cognitive burden on developers.
To uncover the secrets to platform engineering success, Google Cloud partnered with Enterprise Strategy Group (ESG) on a comprehensive research study of 500 global IT professionals and application developers working at organizations with at least 500 employees, all with formal platform engineering teams. Our goal was to understand whether they had adopted platform engineering, and if so, the impact that has had on their company’s software delivery capabilities.
The resulting report, “Building Competitive Edge With Platform Engineering: A Strategic Guide,” reveals common patterns, expectations, and actionable best practices for overcoming challenges and fully leveraging platform engineering. This blog post highlights some of the most powerful insights from this study.
- aside_block
- <ListValue: [StructValue([('title', 'Try Google Cloud for free'), ('body', <wagtail.rich_text.RichText object at 0x3e60edcb19d0>), ('btn_text', 'Get started for free'), ('href', 'https://console.cloud.google.com/freetrial?redirectPath=/welcome'), ('image', None)])]>
Platform engineering is no longer optional
The research confirms that platform engineering is no longer a nascent concept. 55% of the global organizations we invited to participate have already adopted platform engineering. Of those, 90% plan to expand its reach to more developers. Furthermore, 85% of companies using platform engineering report that their developers rely on the platform to succeed. These figures highlight that platform engineering is no longer just a trend; it's becoming a vital strategy for organizations seeking to unlock the full potential of their cloud and IT investments and gain a competitive edge.

Figure 1: 55% of 900+ global organizations surveyed have adopted platform engineering
Three keys to platform engineering success
The report identifies three critical components that are central to the success of mature platform engineering leaders.
-
Fostering close collaboration between platform engineers and other teams to ensure alignment
-
Adopting a “platform as a product” approach, which involves treating the developer platform with a clear roadmap, communicated value, and tight feedback loops
-
Defining success by measuring performance through clear metrics such as deployment frequency, failure recovery time, and lead time for changes
It's noteworthy that while many organizations have begun their platform engineering journey, only 27% of adopters have fully integrated these three key components in their practices, signaling a significant opportunity for further improvements.
AI: platform engineering's new partner
One of the most compelling insights of this report is the synergistic relationship between platform engineering and AI. A remarkable 86% of respondents believe that platform engineering is essential to realizing the full business value of AI. At the same time, a vast majority of companies view AI as a catalyst for advancing platform engineering, with 94% of organizations identifying AI to be ‘Critical’ or ‘Important’ to the future of platform engineering.

Beyond speed: key benefits of platform engineering
The study also identified three cohorts of platform engineering adopters — nascent, established, and leading — based on whether and how much adopters had embraced the above-mentioned three key components of platform engineering success. The study shows that leading adopters gain more in terms of speed, efficiency, and productivity, and offers guidance for nascent and established adopters to improve their overall platform engineering maturity to gain more benefits.
The report also identified some additional benefits of platform engineering, including:
-
Improved employee satisfaction, talent acquisition & retention: mature platforms foster a positive developer experience that directly impacts company culture. Developers and IT pros working for organizations with mature developer platforms are much more likely to recommend their workplace to their peers.
-
Accelerated time to market: mature platform engineering adopters have significantly shortened time to market. 71% of leading adopters of platform engineering indicated they have significantly accelerated their time to market, compared with 28% of less mature adopters.
Don't go it alone
A vast majority (96%) of surveyed organizations are leveraging open-source tools to build their developer platforms. Moreover, most (84%) are partnering with external vendors to manage and support their open-source environments. Co-managed platforms with a third party or a cloud partner benefit from a higher degree of innovation. Organizations with co-managed platforms allocate an average of 47% of their developers’ productive time to innovation and experimentation, compared to just 38% for those that prefer to manage their platforms with internal staff.
Ready to succeed? Explore the full report
While this blog provides a glimpse into the key findings from this study, the full report goes much further, revealing key platform engineering strategies and practices that will help you stay ahead of the curve. Download the report to explore additional topics, including:
-
The strategic considerations of centralized and distributed platform engineering teams
-
The key drivers behind platform engineering investments
-
Top priorities driving platform adoption for developers, ensuring alignment with their needs
-
Key pain points to anticipate and navigate on the road to platform engineering success
-
How platform engineering boosts productivity, performance, and innovation across the entire organization
-
The strategic importance of open source in platform engineering for competitive advantage
-
The transformative role of platform engineering for AI/ML workloads as adoption of AI increases
-
How to develop the right platform engineering strategy to drive scalability and innovation
Software Engineer
Thu, 23 Jan 2025 17:00:00 -0000
Editor’s note: This blog post was updated to reflect the general availability status of these features as of March 31, 2025.
Cloud Deploy is a fully managed continuous delivery platform that automates the delivery of your application. On top of existing automation features, customers tell us they want other ways to automate their deployments to keep their production environments reliable and up to date.
We're happy to announce three new features to help with that, all in GA.
1. Repair rollouts
The new repair rollout automation rule lets you retry failed deployments or automatically roll back to a previously successful release when an error occurs. These errors could come in any phase of a deployment: a pre-deployment SQL migration, a misconfiguration detected when talking to a GKE cluster, or as part of a deployment verification step. In any of these cases, the repair rollout automation lets you retry the failed step a configurable number of times, perfect for those occasionally flaky end-to-end tests. If the retry succeeds, the rollout continues. If the retries fail (or none are configured) the repair rollout automation can also roll back to the previously successful release.
- aside_block
- <ListValue: [StructValue([('title', 'Try Google Cloud for free'), ('body', <wagtail.rich_text.RichText object at 0x3e60efc7fc10>), ('btn_text', 'Get started for free'), ('href', 'https://console.cloud.google.com/freetrial?redirectPath=/welcome'), ('image', None)])]>
2. Deploy policies
Automating deployments is powerful, but it can also be important to put some constraints on the automation. The new deploy policies feature is intended to limit what these automations (or users) can do. Initially, we're launching a time-windows policy which can, for example, inhibit deployments during evenings, weekends, or during important events. While an on-caller with the Policy Overrider role could "break glass" to get around these policies, automated deployments won't be able to trigger a rollout in the middle of your big demo.
3. Timed promotions
After a release is successfully rolled out, you may want to automatically deploy it to the next environment. Our previous auto-promote feature let you promote a release after a specified duration, for example moving it into prod 12 hours after it went to staging. But often you want promotions to happen on a schedule, not based on a delay. Within Google, for example, we typically recommend that teams promote from a dev environment into staging every Thursday, and then start a promotion into prod on Monday mornings. With the new timed promotion automation, Cloud Deploy can handle these scheduled promotions for you.
The future
Comprehensive, easy-to-use, and cost-effective DevOps tools are key to efficient software delivery, and it’s our hope that Cloud Deploy will help you implement complete CI/CD pipelines. Stay tuned as we introduce exciting new capabilities and features to Cloud Deploy in the months to come.
Update your current pipelines with these new features today. Check out the product page, documentation, quickstarts, and tutorials. Finally, if you have feedback on Cloud Deploy, you can join the conversation. We look forward to hearing from you!
Senior Staff Reliability Engineer
Thu, 09 Jan 2025 17:00:00 -0000
Cloud applications like Google Workspace provide benefits such as collaboration, availability, security, and cost-efficiency. However, for cloud application developers, there’s a fundamental conflict between achieving high availability and the constant evolution of cloud applications. Changes to the application, such as new code, configuration updates, or infrastructure rearrangements, can introduce bugs and lead to outages. These risks pose a challenge for developers, who must balance stability and innovation while minimizing disruption to users.
Here on the Google Workspace Site Reliability Engineering team, we once moved a replica of Google Docs to a new data center because we needed extra capacity. But moving the associated data, which was vast, overloaded a key index in our database, restricting user ability to create new docs. Thankfully, we were able to identify the root cause and mitigate the problem quickly. Still, this experience convinced us of the need to reduce the risk of a global outage from a simple application change.
- aside_block
- <ListValue: [StructValue([('title', 'Try Google Cloud for free'), ('body', <wagtail.rich_text.RichText object at 0x3e60eec75a30>), ('btn_text', 'Get started for free'), ('href', 'https://console.cloud.google.com/freetrial?redirectPath=/welcome'), ('image', None)])]>
Limit the blast radius
Our approach to reducing the risk of global outages is to limit the “blast radius,” or extent, of an outage by vertically partitioning the serving stack. The basic idea is to run isolated instances (“partitions”) of application servers and storage (Figure 1). Each partition contains all the various servers necessary to service a user request from end to end. Each production partition also has a pseudo-random mix of users and workloads, so all the partitions have similar resource needs. When it comes time to make changes to the application code, we deploy new changes to one partition at a time. Bad changes may cause a partition-wide outage, but we are protected from a global application outage.
Compare this approach to using canarying alone, in which new features or code changes are released to a small group of users before rolling them out to the rest. While canarying deploys changes first to just a few servers, it doesn’t prevent problems from spreading. For example, we’ve had incidents where canaried changes corrupted data used by all the servers in the deployment. With partitioning, the effects of bad changes are isolated to a single partition, preventing such contagion. Of course, in practice, we combine both techniques: canarying new changes to a few servers within a single partition.

Benefits of partitioning
Broadly speaking, partitioning brings a lot of advantages:
- Availability: Initially, the primary motivation for partitioning was to improve the availability of our services and avoid global outages. In a global outage, an entire service may be down (e.g., users cannot log into Gmail), or a critical user journey (e.g., users cannot create Calendar events) — obviously things to be avoided.
Still, the reliability benefits of partitioning can be hard to quantify; global outages are relatively infrequent, so if you don’t have one for a while, it may be due to partitioning, or may be due to luck. That said, we’ve had several outages that were confined to a single partition, and believe they would have expanded into global outages without it. - Flexibility: We evaluate many changes to our systems by experimenting with data. Many user-facing experiments, such as a change to a UI element, use discrete groups of users. For example, in Gmail we can choose an on-disk layout that stores the message bodies of emails inline with the message metadata, or a layout that separates them into different disk files. The right decision depends on subtle aspects of the workload. For example, separating message metadata and bodies may reduce latency for some user interactions, but requires more compute resources in our backend servers to perform joins between the body and metadata columns. With partitioning, we can easily evaluate the impact of these choices in contained, isolated environments.
- Data location: Google Workspace lets enterprise customers specify that their data be stored in a specific jurisdiction. In our previous, non-partitioned architecture, such guarantees were difficult to provide, especially since services were designed to be globally replicated to reduce latency and take advantage of available capacity.
Challenges
Despite the benefits, there are some challenges to adopt partitioning. In some cases, these challenges make it hard or risky to move from a non-partitioned to a partitioned setup. In other cases, challenges persist even after partitioning. Here are the issues as we see them:
- Not all data models are easy to partition: For example, Google Chat needs to assign both users and chat rooms to partitions. Ideally, a chat and its members would be in a single partition to avoid cross-partition traffic. However, in practice, this is difficult to accomplish. Chat rooms and users form a graph, with users in many chat rooms and chat rooms containing many users. In the worst case, this graph may have only a single connected component — the user. If we were to slice the graph into partitions, we could not guarantee that all users would be in the same partition as their chat rooms.
- Partitioning a live service requires care: Most of our services pre-date partitioning. As a result, adopting partitioning means taking a live service and changing its routing and storage setup. Even if the end goal is higher reliability, making these kinds of changes in a live system is often the source of outages, and can be risky.
- Partition misalignment between services: Our services often communicate with each other. For example, if a new person is added to a Calendar event, Calendar servers make an Remote Procedure Call (RPC) to Gmail delivery servers to send the new invitee an email notification. Similarly, Calendar events with video call links require Calendar to talk to Meet servers for a meeting id. Ideally, we would get the benefits of partitioning even across services. However, aligning partitions between services is difficult. The main reason is that different services tend to use different entity types when determining which partition to use. For example, Calendar partitions on the owner of the calendar while Meet partitions on meeting id. The result is that there is no clear mapping from partitions in one service to another.
- Partitions are smaller than the service: A modern cloud application is served by hundreds or thousands of servers. We run servers at less than full utilization so that we can tolerate spikes in traffic, and because servers that are saturated with traffic generally perform poorly. If we have 500 servers, and target each at 60% CPU utilization, we effectively have 200 spare servers to absorb load spikes. Because we do not fail over between partitions, each partition has access to a much smaller amount of spare capacity. In a non-partitioned setup, a few server crashes may likely go unnoticed, since there is enough headroom to absorb the lost capacity. But in a smaller partition, these crashes may account for a non-trivial portion of the available server capacity, and the remaining servers may become overloaded.
Key takeaways
We can improve the availability of web applications by partitioning their serving stacks. These partitions are isolated, because we do not fail over between them. Users and entities are assigned to partitions in a sticky manner to allow us to roll out changes in order of risk tolerance. This approach allows us to roll out changes one partition at a time with confidence that bad changes will only affect a single partition, and ideally that partition contains only users from your organization.
In short, partitioning supports our efforts to provide stronger and more reliable services to our users, and it might apply to your service as well. For example, you can improve the availability of your application by using Spanner, which provides geo-partitioning out of the box. Read more about geo-partitioning best practices here.
References
Product Leader for Customer Telemetry, Google Cloud
Mon, 06 Jan 2025 17:00:00 -0000
Cloud incidents happen. And when they do, it’s incumbent on the cloud service provider to communicate about the incident to impacted customers quickly and effectively — and for the cloud service consumer to use that information effectively, as part of a larger incident management response.
Google Cloud Personalized Service Health provides businesses with fast, transparent, relevant, and actionable communication about Google Cloud service disruptions, tailored to a specific business at its desired level of granularity. Cybersecurity company Palo Alto Networks is one Google Cloud customer and partner that recently integrated Personalized Service Health signals into the incident workflow for its Google Cloud-based PRISMA Access offering, saving its customers critical minutes during active incidents.
By programmatically ingesting Personalized Service Health signals into advanced workflow components, Palo Alto can quickly make decisions such as triggering contingency actions to protect business continuity.
Let’s take a closer look at how Palo Alto integrated Personalized Service Health into its operations.
- aside_block
- <ListValue: [StructValue([('title', 'Try Google Cloud for free'), ('body', <wagtail.rich_text.RichText object at 0x3e60ee1e2520>), ('btn_text', 'Get started for free'), ('href', 'https://console.cloud.google.com/freetrial?redirectPath=/welcome'), ('image', None)])]>
The Personalized Service Health integration
Palo Alto ingests Personalized Service Health logs into its internal AIOps system, which centralizes incident communications for PRISMA Access and applies advanced techniques to classify and distribute signals to the people responsible for responding to a given incident.

Personalized Service Health UI Incident list view
Users of Personalized Service Health can filter what relevance levels they want to see. Here, “Partially related” reflects an issue anywhere in the world with the products that are used. “Related” reflects that the problem is detected within the data center regions, while “Impacted” means that Google has verified the impact to the customer for specific services.
While Google is still confirming an incident, Personalized Service Health communicates some of these incidents as 'PSH Emerging Incident' to provide customers with early notification. Once Google confirms the incident, these incidents are merged with 'PSH Confirmed Incidents'. This helps customers respond faster to a specific incident that’s impacting their environment or escalate back to Google, if needed.
Personalized Service Health distributes updates throughout an active incident, typically every 30 minutes, or sooner if there’s progress to share. These updates are also written to logs, which Palo Alto ingests into AIOps.
Responding to disruptive, unplanned cloud service provider incidents can be accelerated by programmatically ingesting and distributing incident communications. This is especially true in large-scale organizations such as Palo Alto, which has multiple teams involved in incident response for different applications, workloads and customers.
Fueling the incident lifecycle
Palo Alto further leverages the ingested Personalized Service Health signals in its AIOps platform, which uses machine learning (ML) and analytics to automate IT operations. AIOps harnesses big data from operational appliances to detect and respond to issues instantaneously. AIOps correlates these signals with internally generated alerts to declare an incident that is affecting multiple customers. These AIOps alerts are tied to other incident management tools that assist with managing the incident lifecycle, including communication, regular updates and incident resolution.

In addition, a data enrichment pipeline takes Personalized Service Health incidents, adds Palo Alto’s related information, and publishes the events to Pub/Sub. AIOps then consumes the incident data from Pub/Sub, processes it, correlates it to related events signals, and notifies subscribed channels.
Palo Alto organizes Google Cloud assets into folders within the Google Cloud console. Each project represents a Palo Alto PRISMA Access customer. To receive incident signals that are likewise specific to end customers, Palo Alto creates a log sink that’s specific to each folder, aggregating service health logs at the folder level. Palo Alto then receives incident signals specific to each customer so it can take further action.

Palo Alto drives the following actions based on incident communications flowing from Google Cloud:
-
Proactive detection of zonal, inter-regional, external en-masse failures
-
Accurately identifying workloads affected by cloud provider incidents
-
Correlation of product issue caused by cloud service degradation in Google Cloud Platform itself
Seeing Personalized Service Health’s value
Incidents caused by cloud providers often go unnoticed or are difficult to isolate without involving multiple of the cloud provider’s teams (support, engineering, SRE, account management). The Personalized Service Health alerting framework plus AIOps correlation engine allows Palo Alto’s SRE teams to isolate issues caused by a cloud provider near-instantaneously.

Palo Alto’s incident management workflow is designed to address mass failures versus individual customer outages, ensuring the right teams are engaged until the incidents are resolved. This includes notifying relevant parties, such as the on-call engineer and the Google Cloud support team. With Personalized Service Health, Palo Alto can capture both event types i.e., mass failures as well as individual customer outages.
Palo Alto gets value from Personalized Service Health in multiple ways, beginning with faster incident response and contingency actions with which to optimize business continuity, especially for impacted customers of PRISMA Access. In the event of an incident impacting them, Prisma Access customers naturally seek and expect information from Palo Alto. By ensuring this information flows rapidly from Google Cloud to Palo Alto’s incident response systems, Palo Alto is able to provide more insightful answers to these end customers, and plans to serve additional Palo Alto use cases based on both existing and future Personalized Service Health capabilities.
Take your incident management to the next level
Google Cloud is continually evolving Personalized Service Health to provide deeper value for all Google Cloud customers — from startups, to ISVs and SaaS providers, to the largest enterprises. Ready to get started? Learn more about Personalized Service Health, or reach out to your account team.
We'd like to thank Jose Andrade, Pankhuri Kumar and Sudhanshu Jain of Google for their contributions to this collaboration between PANW and Google Cloud.
Staff Software Engineer
Mon, 09 Dec 2024 17:00:00 -0000
From helping your developers write better code faster with Code Assist, to helping cloud operators more efficiently manage usage with Cloud Assist, Gemini for Google Cloud is your personal AI-powered assistant.
However, understanding exactly how your internal users are using Gemini has been a challenge — until today.
Today we are announcing that Cloud Logging and Cloud Monitoring support for Gemini for Google Cloud. Currently in public preview, Cloud Logging records requests and responses between Gemini for Google Cloud and individual users, while Cloud Monitoring reports 1-day, 7-day, and 28-day Gemini for Google Cloud active users and response counts in aggregate.
- aside_block
- <ListValue: [StructValue([('title', 'Try Google Cloud for free'), ('body', <wagtail.rich_text.RichText object at 0x3e60ee0788b0>), ('btn_text', 'Get started for free'), ('href', 'https://console.cloud.google.com/freetrial?redirectPath=/welcome'), ('image', None)])]>
Cloud Logging
In addition to offering customers general visibility into the impact of Gemini, there are a few scenarios where logs are useful:
-
to track the provenance of your AI-generated content
-
to record and review user usage of Gemini for Google Cloud
This feature is available as opt-in and when enabled, logs your users’ Gemini for Google Cloud activity to Cloud Logging (Cloud Logging charges apply).
Once enabled, log entries are made for each request to and response from Gemini for Google Cloud. In a typical request entry, Logs Explorer would provide an entry similar to the following example:

There are several things to note about this entry:
-
The content inside
jsonPayloadcontains information about the request. In this case, it was a request to complete Python code withdef fibonaccias the input. -
The labels tell you the method (
CompleteCode), the product (code_assist), and the user who initiated the request (cal@google.com). -
The resource labels tell you the instance, location, and resource container (typically project) where the request occurred.
In a typical response entry, you’ll see the following:

Note that the
request_idinside the label are identical for this pair of requests and responses, enabling identification of request and response pairs.In addition to the Log Explorer, Log Analytics supports queries to analyze your log data, and help you answer questions like "How many requests did User XYZ make to Code Assist?"
For more details, please see the Gemini for Google Cloud logging documentation.
Cloud Monitoring
Gemini for Google Cloud monitoring metrics help you answer questions like:
-
How many unique active users used Gemini for Google Cloud services over the past day or seven days?
-
How many total responses did my users receive from Gemini for Google Cloud services over the past six hours?
Cloud Monitoring support for Gemini for Google Cloud is available to anybody who uses a Gemini for Google Cloud product and records responses and active users as Cloud Monitoring metrics, with which dashboards and alerts can be configured.
Because these metrics are available with Cloud Monitoring, you can also use them as part of Cloud Monitoring dashboards. A “Gemini for Google Cloud” dashboard is automatically installed under “GCP Dashboards” when Gemini for Google Cloud usage is detected:
Metrics Explorer offers another avenue where metrics can be examined and filters applied to gain a more detailed view of your usage. This is done by selecting the “Cloud AI Companion Instance” active resource in the Metrics Explorer:

In the example above,
response_countis the number of responses sent by Gemini for Google Cloud, and can be filtered for Gemini Code Assist or the Gemini for Google Cloud method (code completion/generation).For more details, please see the Gemini for Google Cloud monitoring documentation.
What’s next
We’re continually working on additions to these new capabilities, and in particular are focused on Code Assist logging and metrics enhancements that will bring even further insight and observability into your use of Gemini Code Assist and its impact. To get started with Gemini Code Assist and learn more about Gemini Cloud Assist — as well as observability data about it from Cloud Logging and Monitoring — check out the following links:
EMEA Practice Solutions Lead, Application Platform
Tue, 22 Oct 2024 17:00:00 -0000
At the end of the day, developers build, test, deploy and maintain software. But like with lots of things, it’s about the journey, not the destination.
Among platform engineers, we sometimes refer to that journey as the developer experience (DX), which encompasses how developers feel and interact with the tools and services they use throughout the software build, test, deployment and maintenance process.
Prioritizing DX is essential: Frustrated developers lead to inefficiency and talent loss as well as to shadow IT. Conversely, a positive DX drives innovation, community, and productivity. And if you want to provide a positive DX, you need to start measuring how you’re doing.
At PlatformCon 2024, I gave a talk entitled "Improving your developers' platform experience by applying Google frameworks and methods” where I spoke about Google’s HEART Framework, which provides a holistic view of your organization's developers’ experience through actionable data.
In this article, I will share ideas on how you can apply the HEART framework to your Platform Engineering practice, to gain a more comprehensive view of your organization’s developer experience. But before I do that, let me explain what the HEART Framework is.
- aside_block
- <ListValue: [StructValue([('title', 'Try Google Cloud for free'), ('body', <wagtail.rich_text.RichText object at 0x3e60ee594430>), ('btn_text', 'Get started for free'), ('href', 'https://console.cloud.google.com/freetrial?redirectPath=/welcome'), ('image', None)])]>
The HEART Framework: an introduction
In a nutshell, HEART measures developer behaviors and attitudes from their experience of your platform and provides you with insights into what’s going on behind the numbers, by defining specific metrics to track progress towards goals. This is beneficial because continuous improvements through feedback are vital components of a platform engineering journey, helping both platform and application product teams make decisions that are data-driven and user-centered.
However, HEART is not a data collection tool in and of itself; rather, it’s a user-sentiment framework for selecting the right metrics to focus on based on product or platform objectives. It balances quantitative or empirical data, e.g., number of active portal users, with qualitative or subjective insights such as "My users feel the portal navigation is confusing." In other words, consider HEART as a framework or methodology for assessing user experience, rather than a specific tool or assessment. It helps you decide what to measure, not how to measure it.

Let’s take a look at each of these in more detail.
Happiness: Do users actually enjoy using your product?
Highlight: Gathering and analyzing developer feedback
Subjective metrics:
-
Surveys: Conduct regular surveys to gather feedback about overall satisfaction, ease of use, and pain points. Toil negatively affects developer satisfaction and morale. Repetitive, manual work can lead to frustration burnout and decreased happiness with the platform.
-
Feedback mechanisms: Establish easy ways for developers to provide direct feedback on specific features or areas of the platform like Net Promoter Score (NPS) or Customer Satisfaction surveys (CSAT).
-
Collect open-ended feedback from developers through interviews and user groups.
-
Sentiment analysis: Analyze developer sentiment expressed in feedback channels, support tickets and online communities.
System metrics:
-
Feature requests: Track the number and types of feature requests submitted by developers. This provides insights into their needs and desires and can help you prioritize improvements that will enhance happiness.
Watch out for: While platforms can boost developer productivity, they might not necessarily contribute to developer job satisfaction. This warrants further investigation, especially if your research suggests that your developers are unhappy.
Engagement: What is the developer breadth and quality of platform experience?
Highlight: Frequency of interaction between platform engineers with developers and quality of interaction — intensity and quality of interaction with the platform, participation on chat channels, training, dual ownership of golden paths, joint troubleshooting, engaging in architectural design discussions, and the breadth of interaction by everyone from new hires through to senior developers.
Subjective metrics:
-
Survey for quality of interaction — focus on depth and type of interaction whether through chat channel, trainings, dual ownership of golden paths, joint troubleshooting, or architectural design discussions
-
High toil can reduce developer engagement with the platform. When developers spend excessive amounts of time on tedious tasks, they are less likely to explore new features, experiment, and contribute to the platform's evolution.
System metrics:
-
Active users: Track daily, weekly, and monthly active developers and how long they spend on tasks.
-
Usage patterns: Analyze the most used platform features, tools, and portal resources.
-
Frequency of interaction between platform engineers with developers.
-
Breadth of user engagement: Track onboarding time for new hires to reach proficiency, measure the percentage of senior developers actively contributing to golden paths or portal functionality.
Watch out for: Don’t confuse engagement with satisfaction. Developers may rate the platform highly in surveys, but usage data might reveal low frequency of interaction with core features or a limited subset of teams actively using the platform. Ask them “How has the platform changed your daily workflow?” rather than "Are you satisfied with the platform?”
Adoption: What is the platform growth rate and developer feature adoption?
Highlight: Overall acceptance and integration of the platform into the development workflow.
System metrics:
-
New user registrations: Monitor the growth rate of new developers using the platform.
-
Track time between registration and time to use the platform i.e., executing golden paths, tooling and portal functionality.
-
Number of active users per week / month / quarter / half-year / year who authenticate via the portal and/or use golden paths, tooling and portal functionality
-
Feature adoption: Track how quickly and widely new features or updates are used.
-
Percentage of developers using CI/CD through the platform
-
Number of deployments per user / team / day / week / month — basically of your choosing
-
Training: Evaluate changes in adoption, after delivering training.
Watch out for: Overlooking the "long tail" of adoption. A platform might see a burst of early adoption, but then plateau or even decline if it fails to continuously evolve and meet changing developer needs. Don't just measure initial adoption, monitor how usage evolves over weeks, months, and years.
Retention: Are developers loyal to the platform?
Highlight: Long-term engagement and reducing churn.
Subjective metrics:
- Use an exit survey if a user is dormant for 12 or more months.
System metrics:
-
Churn rate: Track the percentage of developers who stop logging into the portal and are not using it.
-
Dormant users: Identify developers who become inactive after 6 months and investigate why.
-
Track services that are less frequently used.
Watch out for: Misinterpreting the reasons for churn. When developers stop using your platform (churn), it's crucial to understand why. Incorrectly identifying the cause can lead to wasted effort and missed opportunities for improvement. Consider factors outside the platform — churn could be caused by changes in project requirements, team structures or industry trends.
Task success: Can developers complete specific tasks?
Highlight: Efficiency and effectiveness of the platform in supporting specific developer activities.
Subjective metrics:
-
Survey to assess the ongoing presence of toil and its inimical influence on developer productivity, ultimately hindering efficiency and leading to increased task completion times.
System metrics:
-
Completion rates: Measure the percentage of golden paths and tools successfully run on the platform without errors.
-
Time to complete tasks using golden paths, portal, or tooling.
-
Error rates: Track common errors and failures developers encounter from log files or monitoring dashboards from golden paths, portal or tooling.
-
Mean Time to Resolution (MTTR): When errors do occur, how long does it take to resolve them? A lower MTTR indicates a more resilient platform and faster recovery from failures.
-
Developer platform and portal uptime: Measure the percentage of time that the developer platform and portal is available and operational. Higher uptime ensures developers can consistently access the platform and complete their tasks.
Watch out for: Don't confuse task success with task completion. Simply measuring whether developers can complete tasks on the platform doesn't necessarily indicate true success. Developers might find workarounds or complete tasks inefficiently, even if they technically achieve the end goal. It may be worth manually observing developer workflows in their natural environment to identify pain points and areas of friction in their workflows.
Also, be careful with misaligning task success with business goals. Task completion might overlook the broader impact on business objectives. A platform might enable developers to complete tasks efficiently, but if those tasks don't contribute to overall business goals, the platform's true value is questionable.
Applying the HEART framework to platform engineering
It’s not necessary to use all of the categories each time. The number of categories to consider really depends on the specific goals and context of the assessment; you can include everything or trim it down to better match your objective. Here are some examples:
-
Improving onboarding for new developers: Focus on adoption, task success and happiness.
-
Launching a new feature: Concentrate on adoption and happiness.
-
Increasing platform usage: Track engagement, retention and task success.
Keep in mind that relying on just one category will likely provide an incomplete picture.
When should you use the framework?
In a perfect world, you would use the HEART framework to establish a baseline assessment a few months after launching your platform, which will provide you with a valuable insight into early developer experience. As your platform evolves, this initial data becomes a benchmark for measuring progress and identifying trends. Early measurement allows you to proactively address UX issues, guide design decisions with data, and iterate quickly for optimal functionality and developer satisfaction. If you're starting with an MVP, conduct the baseline assessment once the core functionality is in place and you have a small group of early users to provide feedback.
After 12 or more months of usage, you can also add metrics to embody a new or more mature platform. This can help you gather deeper insights into your developers’ experience by understanding how they are using the platform, measure the impact of changes you’ve made to the platform, or identify areas for improvement and prioritize future development efforts. If you've added new golden paths, tooling, or enhanced functionality, then you'll need to track metrics that measure their success and impact on developer behavior.
The frequency with which you assess HEART metrics depends on several factors, including:
-
The maturity of your platform: Newer platforms benefit from more frequent reviews (e.g. monthly or quarterly) to track progress and address early issues. As the platform matures, you can reduce the frequency of your HEART assessments (e.g., bi-annually or annually).
-
The rate of change: To ensure updates and changes have a positive impact, apply the HEART framework more frequently when your platform is undergoing a period of rapid evolution such as major platform updates, new portal features or new golden paths, or some change in user behavior. This allows you to closely monitor the effects of each change on key metrics.
-
The size and complexity of your platform: Larger and more complex platforms may require more frequent assessments to capture nuances and potential issues.
-
Your team's capacity: Running HEART assessments requires time and resources. Consider your team's bandwidth and adjust the frequency accordingly.
Schedule periodic deep dives (e.g. quarterly or bi-annually) using the HEART framework to gain a more in-depth understanding of your platform's performance and identify areas for improvement.
Taking more steps towards platform engineering
In this blog post, we’ve shown how the HEART framework can be applied to platform engineering to measure and improve the developer experience. We’ve explored the five key aspects of the framework — happiness, engagement, adoption, retention, and task success — and provided specific metrics for each and guidance on when to apply them.By applying these insights, platform engineering teams can create a more positive and productive environment for their developers, leading to greater success in their software development efforts.To learn more about platform engineering, check out some of our other articles: 5 myths about platform engineering: what it is and what it isn’t, Another five myths about platform engineering, and Laying the foundation for a career in platform engineering.
And finally, check out the DORA Report 2024, which now has a section on Platform Engineering.
DORA Research Lead
Tue, 22 Oct 2024 16:00:00 -0000
The DORA research program has been investigating the capabilities, practices, and measures of high-performing technology-driven teams and organizations for more than a decade. It has published reports based on data collected from annual surveys of professionals working in technical roles, including software developers, managers, and senior executives.
Today, we’re pleased to announce the publication of the 2024 Accelerate State of DevOps Report, marking a decade of DORA’s investigation into high-performing technology teams and organizations. DORA’s four key metrics, introduced in 2013, have become the industry standard for measuring software delivery performance.
Each year, we seek to gain a comprehensive understanding of standard DORA performance metrics, and how they intersect with individual, workflow, team, and product performance. We now include how AI adoption affects software development across multiple levels, too.

We also establish reference points each year to help teams understand how they are performing, relative to their peers, and to inspire teams with the knowledge that elite performance is possible in every industry. DORA’s research over the last decade has been designed to help teams get better at getting better: to strive to improve their improvements year over year.
For a quick overview of this year’s report, you can read in our executive DORA Report summary the spotlight adoption trends and the impact of AI, the emergence of platform engineering, and the continuing significance of developer experience.
Organizations across all industries are prioritizing the integration of AI into their applications and services. Developers are increasingly relying on AI to improve their productivity and fulfill their core responsibilities. This year's research reveals a complex landscape of benefits and tradeoffs for AI adoption.
The report underscores the need to approach platform engineering thoughtfully, and emphasizes the critical role of developer experience in achieving high performance.
- aside_block
- <ListValue: [StructValue([('title', 'Try Google Cloud for free'), ('body', <wagtail.rich_text.RichText object at 0x3e60f05d03d0>), ('btn_text', 'Get started for free'), ('href', 'https://console.cloud.google.com/freetrial?redirectPath=/welcome'), ('image', None)])]>
AI: Benefits, challenges, and developing trust
Widespread AI adoption is reshaping software development practices. More than 75 percent of respondents said that they rely on AI for at least one daily professional responsibility. The most prevalent use cases include code writing, information summarization, and code explanation.
The report confirms that AI is boosting productivity for many developers. More than one-third of respondents experienced”‘moderate” to “extreme” productivity increases due to AI.

A 25% increase in AI adoption is associated with improvements in several key areas:
-
7.5% increase in documentation quality
-
3.4% increase in code quality
-
3.1% increase in code review speed
However, despite AI’s potential benefits, our research revealed a critical finding: AI adoption may negatively impact software delivery performance. As AI adoption increased, it was accompanied by an estimated decrease in delivery throughput by 1.5%, and an estimated reduction in delivery stability by 7.2%. Our data suggest that improving the development process does not automatically improve software delivery — at least not without proper adherence to the basics of successful software delivery, like small batch sizes and robust testing mechanisms. AI has positive impacts on many important individual and organizational factors which foster the conditions for high software delivery performance. But, AI does not appear to be a panacea.
Our research also shows that despite the productivity gains, 39% of the respondents reported little to no trust in AI-generated code. This unexpected low level of trust indicates to us that there is a need to manage AI integration more thoughtfully. Teams must carefully evaluate AI’s role in their development workflow to mitigate the downsides.
Based on these findings, we have three core recommendations:
-
Enable your employees and reduce toil by orienting your AI adoption strategies towards empowering employees and alleviating the burden of undesirable tasks.
-
Establish clear guidelines for the use of AI and address procedural concerns and foster open communication about its impact.
-
Encourage continuous exploration of AI tools and provide them dedicated time for experimentation, and promote trust through hands-on experience.
Platform engineering: A paradigm shift
Another emerging discipline our research focused this year is on platform engineering. Its focus is on building and operating internal development platforms to streamline processes and enhance efficiency

Our research identified 4 key findings regarding platform engineering:
-
Increased developer productivity: Internal development platforms effectively increase productivity for developers.
-
Prevalence in larger firms: These platforms are more commonly found in larger organizations, suggesting their suitability for managing complex development environments.
-
Potential performance dip: Implementing a platform engineering initiative might lead to a temporary decrease in performance before improvements manifest as the platform matures.
-
Need for user-centeredness and developer independence: For optimal results, platform engineering efforts should prioritize user-centered design, developer independence, and a product-oriented approach
A thoughtful approach that prioritizes user needs, empowers developers, and anticipates potential challenges is key to maximizing the benefits of platform engineering initiatives.
Developer experience: The cornerstone of success
One of the key insights in last year’s report was that a healthy culture can help reduce burnout, increase productivity, and increase job satisfaction. This year was no different. Teams that cultivate a stable and supportive environment that empowers developers to excel drive positive outcomes.
Move fast and constantly pivot’ mentality negatively impacts developer well-being and consequently, on overall performance. Instability in priorities, even with strong leadership, comprehensive documentation, and a user-centered approach — all known to be highly beneficial — can significantly hinder progress.
Creating a work environment where your team feels supported, valued, and empowered to contribute is fundamental to achieving high performance.
How to use these findings to help your DevOps team
The key takeaway from the decade of research is that software development success hinges not just on technical prowess but also on fostering a supportive culture, prioritizing user needs, and focusing on developer experience. We encourage teams to replicate our findings within your specific context.
It can be used as a hypothesis for your experiments and continuous improvement initiatives. Please share those with us and the DORA community, so that your efforts can become part of our collaborative learning environment.
We work on this research in hopes that it serves as a roadmap for teams and organizations seeking to improve their practices and create a thriving environment for innovation, collaboration, and business success. We will continue our platform-agnostic research that focuses on the human aspect of technology for the next decade to come.
To learn more:
-
Share your experiences, learn from others, and get inspiration by joining the DORA community.
-
Measure your team’s software delivery performance in less than a minute using DORA's Quick Check.
Product Manager - Google Cloud Databases
Thu, 10 Oct 2024 14:00:00 -0000
Organizations are grappling with an explosion of operational data spread across an increasingly diverse and complex database landscape. This complexity often results in costly outages, performance bottlenecks, security vulnerabilities, and compliance gaps, hindering their ability to extract valuable insights and deliver exceptional customer experiences. To help businesses overcome these challenges, earlier this year, we announced the preview of Database Center, an AI-powered, unified fleet management solution.
We’re seeing accelerated adoption for Database Center from many customers. For example, Ford uses Database Center to get answers on their database fleet health in seconds, and proactively mitigates potential risks to their applications. Today, we’re announcing that Database Center is now available to all customers, empowering you to monitor and operate database fleets at scale with a single, unified solution. We've also added support for Spanner, so you can manage it along with your Cloud SQL and AlloyDB deployments, with support for additional databases on the way.
Database Center is designed to bring order to the chaos of your database fleet, and unlock the true potential of your data. It provides a single, intuitive interface where you can:
-
Gain a comprehensive view of your entire database fleet. No more silos of information or hunting through bespoke tools and spreadsheets.
-
Proactively de-risk your fleet with intelligent performance and security recommendations. Database Center provides actionable insights to help you stay ahead of potential problems, and helps improve performance, reduce costs and enhance security with data-driven suggestions.
-
Optimize your database fleet with AI-powered assistance. Use a natural-language chat interface to ask questions and quickly resolve fleet issues and get optimization recommendations.
Let’s now review each in more detail.
Gain a comprehensive view of your database fleet
Tired of juggling different tools and consoles to keep track of your databases?
Database Center simplifies database management with a single, unified view of your entire database landscape. You can monitor database resources across your entire organization, spanning multiple engines, versions, regions, projects and environments (or applications using labels).
Cloud SQL, AlloyDB, and now Spanner are all fully integrated with Database Center, so you can monitor your inventory and proactively detect issues. Using the unified inventory view in Database Center, you can:
-
Identify out-of-date database versions to ensure proper support and reliability
-
Track version upgrades, e.g., if PostgreSQL 14 to PostgreSQL 15 is updating at an expected pace
-
Ensure database resources are appropriately distributed, e.g., identify the number of databases powering the critical production applications vs. non-critical dev/test environments
-
Monitor database migration from on-prem to cloud or across engines
Manage Cloud SQL, AlloyDB and Spanner resources with a unified view.
Proactively de-risk your fleet with recommendations
Managing your database fleet health at scale can involve navigating through a complex blend of security postures, data protection settings, resource configurations, performance tuning and cost optimizations. Database Center proactively detects issues associated with these configurations and guides you through addressing them.
For example, high transaction ID for a Cloud SQL instance can lead to the database no longer accepting new queries, potentially causing latency issues or even downtime. Database Center proactively detects this, provides an in-depth explanation, and walks you through prescriptive steps to troubleshoot the issue.
We’ve also added several performance recommendations to Database Center related to excessive tables/joins, connections, or logs, and can assist you through a simple optimization journey.
End-to-end workflow for detecting and troubleshooting performance issues.
Database Center also simplifies compliance management by automatically detecting and reporting violations across a wide range of industry standards, including CIS, PCI-DSS, SOC2, HIPAA. Database Center continuously monitors your databases for potential compliance violations. When a violation is detected, you receive a clear explanation of the problem, including:
-
The specific security or reliability issue causing the violation
-
Actionable steps to help address the issue and restore compliance
This helps reduce the risk of costly penalties, simplifies compliance audits and strengthens your security posture. Database Center now also supports real-time detection of unauthorized access, updates, and data exports.
Database Center helps ensure compliance to HIPAA standards.
Optimize your fleet with AI-powered assistance
With Gemini enabled, Database Center makes optimizing your database fleet incredibly intuitive. Simply chat with the AI-powered interface to get precise answers, uncover issues within your database fleet, troubleshoot problems, and quickly implement solutions. For example, you can quickly identify under-provisioned instances across your entire fleet, access actionable insights such as the duration of high CPU/Memory utilization conditions, receive recommendations for optimal CPU/memory configurations, and learn about the associated cost of those adjustments.
AI-powered chat in Database Center provides comprehensive information and recommendations across all aspects of database management, including inventory, performance, availability and data protection. Additionally, AI-powered cost recommendations suggest ways for optimizing your spend, and advanced security and compliance recommendations help strengthen your security and compliance posture.
AI-powered chat to identify data protection issues and optimize cost.
Get started with Database Center today
The new capabilities of Database Center are available in preview today for Spanner, Cloud SQL, and AlloyDB for all customers. Simply access Database Center within the Google Cloud console and begin monitoring and managing your entire databases fleet. To learn more about Database Center’s capabilities, check out the documentation.
-
Product Manager, Google Cloud
Tue, 08 Oct 2024 16:00:00 -0000
Editor's note: Starting February 4, 2025, pipe syntax will be available to all BigQuery users by default.
Log data has become an invaluable resource for organizations seeking to understand application behavior, optimize performance, strengthen security, and enhance user experiences. But the sheer volume and complexity of logs generated by modern applications can feel overwhelming. How do you extract meaningful insights from this sea of data?
At Google Cloud, we’re committed to providing you with the most powerful and intuitive tools to unlock the full potential of your log data. That's why we're thrilled to announce a series of innovations in BigQuery and Cloud Logging designed to revolutionize the way you manage, analyze, and derive value from your logs.
BigQuery pipe syntax: Reimagine SQL for log data
Say goodbye to the days of deciphering complex, nested SQL queries. BigQuery pipe syntax ushers in a new era of SQL, specifically designed with the semi-structured nature of log data in mind. BigQuery’s pipe syntax introduces an intuitive, top-down syntax that mirrors how you naturally approach data transformations. As demonstrated in the recent research by Google, this approach leads to significant improvements in query readability and writability. By visually separating different stages of a query with the pipe symbol (|>), it becomes remarkably easy to understand the logical flow of data transformation. Each step is clear, concise, and self-contained, making your queries more approachable for both you and your team.
BigQuery’s pipe syntax isn’t just about cleaner SQL — it’s about unlocking a more intuitive and efficient way to work with your data. Instead of wrestling with code, experience faster insights, improved collaboration, and more time spent extracting value.
This streamlined approach is especially powerful when it comes to the world of log analysis.
With log analysis, exploration is key. Log analysis is rarely a straight line from question to answer. Analyzing logs often means sifting through mountains of data to find specific events or patterns. You explore, you discover, and you refine your approach as you go. Pipe syntax embraces this iterative approach. You can smoothly chain together filters (WHERE), aggregations (COUNT), and sorting (ORDER BY) to extract those golden insights. You can also add or remove steps in your data processing as you uncover new insights, easily adjusting your analysis on the fly.
Imagine you want to count the total number of users who were affected by the same errors more than 100 times in the month of January. As shown below, the pipe syntax’s linear structure clearly shows the data flowing through each transformation: starting from the table, filtering by the dates, counting by user id and error type, filtering for errors >100, and finally counting the number of users affected by the same errors.
- code_block
- <ListValue: [StructValue([('code', "-- Pipe Syntax \r\nFROM log_table \r\n|> WHERE datetime BETWEEN DATETIME '2024-01-01' AND '2024-01-31'\r\n|> AGGREGATE COUNT(log_id) AS error_count GROUP BY user_id, error_type\r\n|> WHERE error_count>100\r\n|> AGGREGATE COUNT(user_id) AS user_count GROUP BY error_type"), ('language', ''), ('caption', <wagtail.rich_text.RichText object at 0x3e60eed92820>)])]>
The same example in the standard syntax will typically require using a subquery and non linear structure.
- code_block
- <ListValue: [StructValue([('code', "-- Standard Syntax \r\nSELECT error_type, COUNT(user_id)\r\nFROM (\r\n SELECT user_id, error_type, \r\n count (log_id) AS error_count \r\n FROM log_table \r\n WHERE datetime BETWEEN DATETIME '2024-01-01' AND DATETIME '2024-01-31'\r\n GROUP BY user_id, error_type\r\n)\r\nGROUP BY error_type\r\nWHERE error_count > 100;"), ('language', ''), ('caption', <wagtail.rich_text.RichText object at 0x3e60eed92eb0>)])]>
Carrefour: A customer's perspective
The impact of these advancements is already being felt by our customers. Here's what Carrefour, a global leader in retail, had to say about their experience with pipe syntax:
"Pipe syntax has been a very refreshing addition to BigQuery. We started using it to dig into our audit logs, where we often use Common Table Expressions (CTEs) and aggregations. With pipe syntax, we can filter and aggregate data on the fly by just adding more pipes to the same query. This iterative approach is very intuitive and natural to read and write. We are now using it for our analysis work in every business domain. We will have a hard time going back to the old SQL syntax now!" - Axel Thevenot, Lead Data Engineer, and Guillaume Blaquiere, Data Architect, Carrefour
BigQuery pipe syntax is currently available for all BigQuery users. You can check-out this introductory video.
Beyond syntax: performance and flexibility
But we haven't stopped at simplifying your code. BigQuery now offers enhanced performance and powerful JSON handling capabilities to further accelerate your log analytics workflows. Given the prevalence of json data in logs, we expect these changes to simplify log analytics for a majority of users.
-
Enhanced Point Lookups: Pinpoint critical events in massive datasets quickly using BigQuery's numeric search indexes, which dramatically accelerates queries that filter on timestamps and unique IDs. Here is a sample improvement from the announcement blog.
-
Powerful JSON Analysis: Parse and analyze your JSON-formatted log data with ease using BigQuery's JSON_KEYS function and JSONPath traversal feature. Extract specific fields, filter on nested values, and navigate complex JSON structures without breaking a sweat.
-
JSON_KEYS extracts unique JSON keys from JSON data for easier schema exploration and discoverability
-
- JSONPath with LAX modes lets you easily fetch JSON arrays without having to use verbose UNNEST. The example below shows how to fetch all phone numbers from the person field, before and after:
- code_block
- <ListValue: [StructValue([('code', '-- consider a JSON field ‘Person’ as\r\n[{\r\n "name": "Bob",\r\n "phone":[{"type": "home", "number": 20}, {"number":30}]\r\n}]\r\n\r\n--Previously, to fetch all phone numbers from ‘Person’ column\r\nSELECT phone.number\r\nFROM (\r\nSELECT IF(JSON_TYPE(person.phone) = "array", JSON_QUERY_ARRAY (person.phone), [person.phone]) as nested_phone\r\nFrom (\r\nSELECT IF(JSON_TYPE(person)= "array", JSON_QUERY_ARRAY(person), [person])as nested_person\r\nFROM t), UNNEST(nested_person) person), UNNEST (nested_phone)phone\r\n\r\n--With Lax Mode\r\nSELECT JSON_QUERY(person, "lax recursive $.phone.number") FROM t'), ('language', ''), ('caption', <wagtail.rich_text.RichText object at 0x3e60eed92d30>)])]>
Log Analytics in Cloud Logging: Bringing it all together
Log Analytics in Cloud Logging is built on top of BigQuery and provides a UI that’s purpose-built for log analysis. With an integrated date/time picker, charting and dashboarding, Log Analytics makes use of the JSON capabilities to support advanced queries and analyze logs faster. To seamlessly integrate these powerful capabilities into your log management workflow, we're also enhancing Log Analytics (in Cloud Logging) with pipe syntax. You can now analyze your logs within Log Analytics leveraging the full power of BigQuery pipe syntax, enhanced lookups, and JSON handling, all within a unified platform.
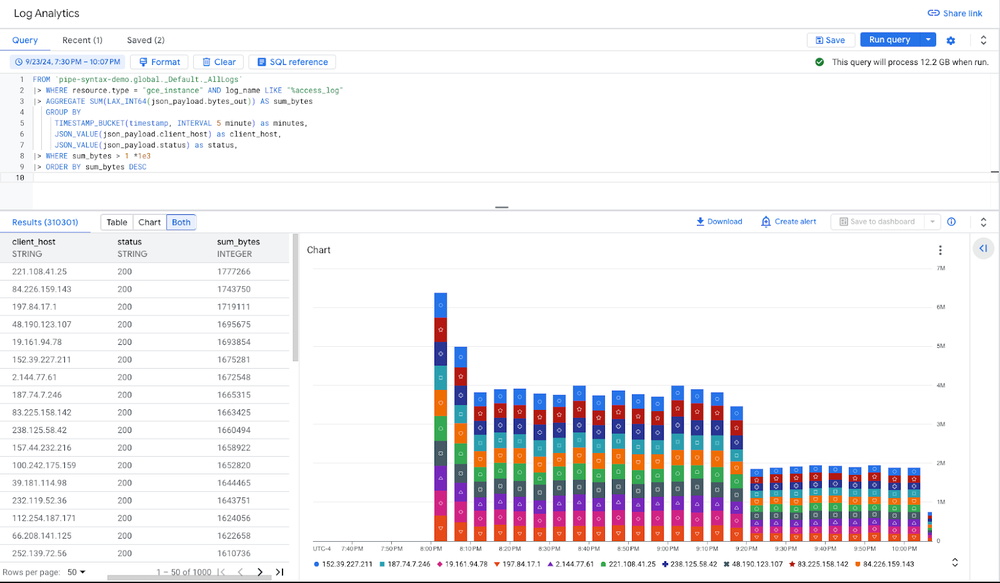
Use of pipe syntax in Log Analytics (Cloud Logging) is now available in preview.
Unlock the future of log analytics today
BigQuery and Cloud Logging provide an unmatched solution for managing, analyzing, and extracting actionable insights from your log data. Explore these new capabilities today and experience the power of:
-
Intuitive querying with pipe syntax - Introductory video, Documentation
-
Unified log management and analysis with Log Analytics in Cloud Logging
-
Blazing-fast lookups with numeric search indexes - Documentation
Start your journey towards more insightful and efficient log analytics in the cloud with BigQuery and Cloud Logging. Your data holds the answers — we're here to help you find them.
Chief Evangelist, Google Cloud
Fri, 04 Oct 2024 17:00:00 -0000
As AI adoption speeds up, one thing is becoming clear: the developer platforms that got you this far won’t get you to the next stage. While yesterday’s platforms were awesome, let’s face it, they weren’t built for today’s AI-infused application development and deployment. And organizations are quickly realizing they need to update their platform strategies to ensure that developers — and the wider set of folks using AI — have what they need for the years ahead.
In fact, as I explore in a new paper, nine out of ten decision makers are prioritizing the task of optimizing workloads for AI over the next 12 months. Problem is, given the pace of change lately, many don’t know where to start or what they need when it comes to modernizing their developer platforms.
What follows is a quick look at the key steps involved in planning your platform strategy. For all the details, download my full guide, Three pillars of a modern, AI-ready platform.
Step 1. Define your platform’s purpose
Whether you’re building your first platform or your fiftieth, you need to start by asking, “Why?” After all, a new platform is another asset to maintain and operate —you need to make sure it exists for the right reasons.
To build your case, ask yourself three questions:
- Who is the platform for? Your platform’s customers, or users, can include developers, architects, product teams, SREs and Ops personnel, data scientists, security teams, and platform owners. Each has different needs, and your platform will need to be tailored accordingly.
- What are its goals? Work out what problems you’re trying to solve. For example, are you optimizing for AI? Striving to speed up software delivery? Increasing developer productivity? Improving scale or security? Again, different goals will lead you down different paths for your platform — so map them out right from the start.
- How will you measure success? To prove the worth of your platform, and to convince stakeholders to invest in its ongoing maintenance, establish metrics from the outset, and keep on measuring them! These could range from improved customer satisfaction to faster time-to-resolution for support issues.
Step 2. Assemble the pieces of your platform
Now that you’re clear on the customers, goals, and performance metrics of the platform you need, it’s time to actually build the thing. Here’s a glance at the key components of a modern, AI-ready platform — complete with the capabilities developers need to hit the ground running when developing AI-powered solutions.

For a detailed breakdown of what to consider in each area of your platform, including a list of technology options for each category, head over to the full paper.
Step 3. Establish a process for improving your platform
The journey doesn’t end once your platform’s built. In fact, it’s just beginning. A platform is never “done;” it’s just released. As such, you need to adopt a continuous improvement mindset and assign a core platform team the task of finding new ways to introduce value to stakeholders.
At this stage, my top tip is to treat your platform like a product, applying platform engineering principles to keep making it faster, cheaper, and easier to deliver software. Oh, and to leverage the latest in AI-driven optimization tools to monitor and maintain your platform over time!
Ready to start your platform journey?
Organizations embark on platform overhauls for a whole bunch of reasons. Some do it to better cope with forecasted growth. Others have AI adoption in their sights. Then there are those driven by cost, performance, or the user experience. Whatever your reason for getting started, I encourage you to read the full paper on building a modern AI-ready platform — your developers (and the business) will thank you.
Technical Program Management
Fri, 27 Sep 2024 16:00:00 -0000
You’ve probably felt the frustration that arises when a project fails to meet established deadlines. And perhaps you’ve also encountered scenarios where project staff or computing have been reallocated to higher priority projects. It can be super challenging to get projects done on time with this kind of uncertainty.
That’s especially true for Site Reliability Engineering (SRE) teams. Project management principles can help, but in IT, many project management frameworks are directed at teams that have a single focus, such as a software-development team.
That’s not true for SRE teams at Google. They are charged with delivering infrastructure projects as well as their primary role: supporting production. Broadly speaking, SRE time is divided in half between supporting production environments and focusing on product.
A common problem
In a recent endeavor, our SRE team took on a project to regionalize our infrastructure to enhance the reliability, security, and compliance of our cloud services. The project was allocated a well-defined timeline, driven by our commitments to our customers and adherence to local regulations. As the technical program manager (TPM), I decomposed the overarching goal into smaller milestones and communicated to the leadership team to ensure they remained abreast of the progress.
However, throughout the execution phase of the project, we encountered a multitude of unrelated production incidents — the Spanner queue was growing long, and the accumulation of messages led to increased compilation times for our developer builds; this in turn led to bad builds rolling out. On top of this, asynchronous tasks were not completing as expected. When the bad build was rolled back, all of the backlogged async tasks fired at once. Due to these unforeseen challenges, some engineers were temporarily reassigned from the regionalization project to handle operational constraints associated with production infrastructure. No surprise, the change in staff allocation towards production incidents resulted in the project work being delayed.
Better planning with SRE
Teams that manage production services, like SRE, have many ways to solve tough problems. The secret is to choose the solution that gets the job done the fastest and with the least amount of red tape for engineers to deal with.
In our organization, we’ve started taking a proactive approach to problem-solving by incorporating enhanced planning at the project's inception. As a TPM, my biggest trick to ensuring projects are finished on time is keeping some engineering hours in reserve and planning carefully when the project should start.
How many resources should you hold back, exactly? We did a deep dive into our past production issues and how we've been using our resources. Based on this, when planning SRE projects, we set aside 25% of our time for production work. Of course, this 25% buffer number will differ across organizations, but this new approach, which takes into account our critical business needs, has been a game-changer for us in making sure our projects are delivered on time, while ensuring that SREs can still focus on production incidents — our top priority for the business.
Key takeaways
In a nutshell, planning for SRE projects is different from planning for projects in development organizations, because development organizations spend the lion’s share of their time working on projects. Luckily, SRE Program Management is really good at handling complicated situations, especially big programs.
Beyond holding back resources, here are few other best practices and structures that TPMs employ when planning SRE projects:
-
Ensuring that critical programs are staffed for success
-
Providing opportunities for TPMs to work across services, cross pollinating with standardized solutions and avoiding duplication of work
-
Providing more education to Site Reliability Managers and SREs on the value of early TPM engagement and encourage services to surface problem statements earlier
-
Leveraging the skills of TPMs to manage external dependencies and interface with other partner organizations such as Engineering, Infrastructure Change Management, and Technical Infrastructure
-
Providing coverage at times of need for services with otherwise low program management demands
-
Enabling consistent performance evaluation and provide opportunities for career development for the TPM community
The TPM role within SRE is at the heart of fulfilling SRE’s mission: making workflows faster, more reliable, and preparing for the continued growth of Google's infrastructure. As a TPM, you need to ensure that systems and services are carefully planned and deployed, taking into account multiple variables such as price, availability, and scheduling, while always keeping the bigger picture in mind. To learn more about project management for TPMs and related roles, consider enrolling in this course, and check out the following resources:
-
AI/ML Customer Engineer, UKI, Google Cloud
Fri, 30 Aug 2024 16:00:00 -0000
Who is supposed to manage generative AI applications? While AI-related ownership often lands with data teams, we're seeing requirements specific to generative AI applications that have distinct differences from those of a data and AI team, and at times more similarities with a DevOps team. This blog post explores these similarities and differences, and considers the need for a new ‘GenOps’ team to cater for the unique characteristics of generative AI applications.
In contrast to data science which is about creating models from data, Generative AI relates to creating AI enabled services from models and is concerned with the integration of pre-existing data, models and APIs. When viewed this way, Generative AI can feel similar to a traditional microservices environment: multiple discrete, decoupled and interoperable services consumed via APIs. And if there are similarities with the landscape, then it is logical that they share common operational requirements. So what practices can we take from the world of microservices and DevOps and bring to the new world of GenOps?
What are we operationalising? The AI agent vs the microservice
How do the operational requirements of a generative AI application differ from other applications? With traditional applications, the unit of operationalisation is the microservice. A discrete, functional unit of code, packaged up into a container and deployed into a container-native runtime such as kubernetes. For generative AI applications, the comparative unit is the generative AI agent: also a discrete, functional unit of code defined to handle a specific task, but with some additional constituent components that make it more than ‘just’ a microservice and add in its key differentiating behavior of being non-deterministic in terms of both its processing and its output:
-
Reasoning loop - The control logic defining what the agent does and how it works. It often includes iterative logic or thought chains to break down an initial task into a series of model-powered steps that work towards the completion of a task.
-
Model definitions - One or a set of defined access patterns for communicating with models, readable and usable by the Reasoning Loop
-
Tool definitions - a set of defined access patterns for other services external to the agent, such as other agents, data access (RAG) flows, and external APIs. These should be shared across agents, exposed through APIs and hence a Tool definition will take the form of a machine-readable standard such as an OpenAPI specification.
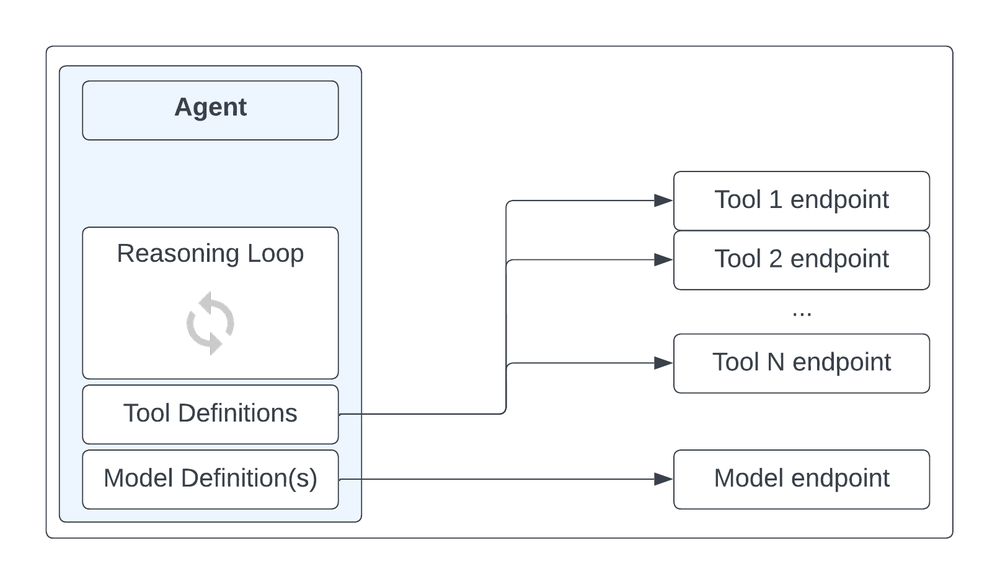
Logical components of a generative AI agent
The Reasoning Loop is essentially the full scope of a microservice, and the model and Tool definitions are its additional powers that make it into something more. Importantly, although the Reasoning Loop logic is just code and therefore deterministic in nature, it is driven by the responses from non-deterministic AI models, and this non-deterministic nature is what provides the need for the Tool, as the agent ‘chooses for itself’ which external service should be used to fulfill a task. A fully deterministic microservice has no need for this ‘cookbook’ of Tools for it to select from: Its calls to external services are pre-determined and hard coded into the Reasoning Loop.
However there are still many similarities. Just like a microservice, an agent:
-
Is a discrete unit of function that should be shared across multiple apps/users/teams in a multi-tenancy pattern
-
Has a lot of flexibility with development approaches, a wide range of software languages are available to use, and any one agent can be built in a different way to another.
-
Has very low inter-dependency from one agent to another: development lifecycles are decoupled with independent CI/CD pipelines for each. The upgrade of one agent should not affect another agent.
Operational platforms and separation of responsibilities
Another important difference is service-discovery. This is a solved-problem in the world of microservices where the impracticalities for microservices to track the availability, whereabouts and networking considerations for communicating with each other were taken out of the microservice itself and handled by packaging the microservices into containers and deploying these into a common platform layer of kubernetes and Istio. With Generative AI agents, this consolidation onto a standard deployment unit has not yet happened. There are a range of ways to build and deploy a generative AI agent, from code-first DIY approaches through to no-code managed agent builder environments. I am not against these tools in principle, however they are creating a more heterogeneous deployment landscape than what we have today with microservices applications and I expect this will create future operational complexities.
To deal with this, at least for now, we need to move away from the Point-to-Point model seen in microservices and adopt a Hub-and-Spoke model, where the discoverability of agents, Tools and models is done via the publication of APIs onto an API Gateway that provides a consistent abstraction layer above this inconsistent landscape.
This brings the additional benefit of clear separation of responsibilities between the apps and agents built by development teams, and Generative AI specific components such as models and Tools:
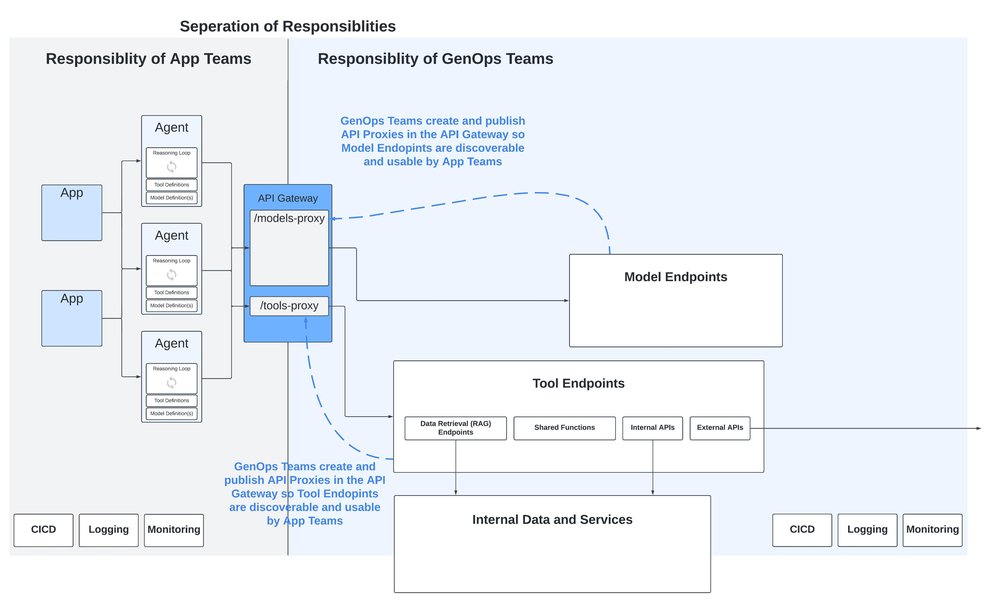
Separating responsibilities with an API Gateway
All operational platforms should create a clear point of separation between the roles and responsibilities of app and microservice development teams from the responsibilities of the operational teams. With microservice based applications, responsibilities are handed over at the point of deployment, and focus switches to non-functional requirements such as reliability, scalability, infrastructure efficiency, networking and security.
Many of these requirements are still just as important for a generative AI app, and I believe there are some additional considerations specific to generative agents and apps which require specific operational tooling:
1. Model compliance and approval controls
There are a lot of models out there. Some are open-source, some are licensed. Some provide intellectual property indemnity, some do not. All have specific and complex usage terms that have large potential ramifications but take time and the right skillset to fully understand.It’s not reasonable or appropriate to expect our developers to have the time or knowledge to factor in these considerations during model selection. Instead, an organization should have a separate model review and approval process to determine whether usage terms are acceptable for further use, owned by legal and compliance teams, supported on a technical level by clear, governable and auditable approval/denial processes that cascade down into development environments.
2. Prompt version management
Prompts need to be optimized for each model. Do we want our app teams focusing on prompt optimization, or on building great apps? Prompt management is a non-functional component and should be taken out of the app source code and managed centrally where they can be optimized, periodically evaluated, and reused across apps and agents.3. Model (and prompt) evaluation
Just like an MLOps platform, there is clearly a need for ongoing assessments of model response quality to enable a data-driven approach to evaluating and selecting the most optimal models for a particular use-case. The key difference with Gen AI models being the assessment is inherently more qualitative compared to the quantitative analysis of skew or drift detection of a traditional ML model.Subjective, qualitative assessments performed by humans are clearly not scalable, and introduce inconsistency when performed by multiple people. Instead, we need consistent automated pipelines powered by AI evaluators, which although imperfect, will provide consistency in the assessments and a baseline to compare models against each other.
4. Model security gateway
The single most common operational feature I hear large enterprises investing time into is a security proxy for safety checks before passing a prompt on to a model (as well as the reverse: a check against the generated response before passing back to the client).Common considerations:
-
Prompt Injection attacks and other threats captured by OWASP Top 10 for LLMs
-
Harmful / unethical prompts
-
Customer PII or other data requiring redaction prior to sending on to the model and other downstream systems
Some models have built in security controls; however this creates inconsistency and increased complexity. Instead a model agnostic security endpoint abstracted above all models is required to create consistency and allow for easier model switching.
5. Centralized Tool management
Finally, the Tools available to the agent should be abstracted out from the agent to allow for reuse and centralized governance. This is the right separation of responsibilities especially when involving data retrieval patterns where access to data needs to be controlled.RAG patterns have the potential to become numerous and complex, as well as in practice not being particularly robust or well maintained with the potential of causing significant technical debt, so central control is important to keep data access patterns as clean and visible as possible.
Outside of these specific considerations, a prerequisite already discussed is the need for the API Gateway itself to create consistency and abstraction above these Generative AI specific services. When used to their fullest, API Gateways can act as much more than simply an API Endpoint but can be a coordination and packaging point for a series of interim API calls and logic, security features and usage monitoring.
For example, a published API for sending a request to a model can be the starting point for a multi-step process:
-
Retrieving and ‘hydrating’ the optimal prompt template for that use case and model
-
Running security checks through the model safety service
-
Sending the request to the model
-
Persisting prompt, response and other information for use in operational processes such as model and prompt evaluation pipelines.

Key components of a GenOps platform
Making GenOps a reality with Google Cloud
For each of the considerations above, Google Cloud provides unique and differentiating managed services offerings to support with evaluating, deploying, securing and upgrading Generative AI applications and agents:
- Model compliance and approval controls - Google Cloud’s Model Garden is the central model library for over 150 of Google first-party models, partner models, or open source models, with thousands more available via the direct integration with Hugging Face.
- Model security - The newly announced Model Armor, expected to be in preview in Q3, enables inspection, routing and protection of foundation model prompts and responses. It can help with mitigating risks such as prompt injections, jailbreaks, toxic content and sensitive data leakage.
- Prompt version management - Upcoming prompt management capabilities were announced at Google Cloud Next ‘24 that include centralized version controlling, templating, branching and sharing of prompts. We also showcased AI prompt assistance capabilities to critique and automatically re-write prompts.
- Model (and prompt) evaluation - Google Cloud’s model evaluation services provide automatic evaluations for a wide range of metrics prompts and responses enabling extensible evaluation patterns such as evaluating the responses from two models for a given input, or the responses from two different prompts for the same model.
- Centralized Tool management - A comprehensive suite of managed services are available supporting Tool creation. A few to call out are the Document AI Layout Parser for intelligent document chunking, the multimodal embeddings API, Vertex AI Vector Search, and I specifically want to highlight Vertex AI Search: a fully managed, end-to-end OOTB RAG service, handling all the complexities from parsing and chunking documents, to creating and storing embeddings.
As for the API Gateway, Google Cloud’s Apigee allows for publishing and exposure of models and Tools as API Proxies which can encompass multiple downstream API calls, as well as include conditional logic, reties, and tooling for security, usage monitoring and cross charging.
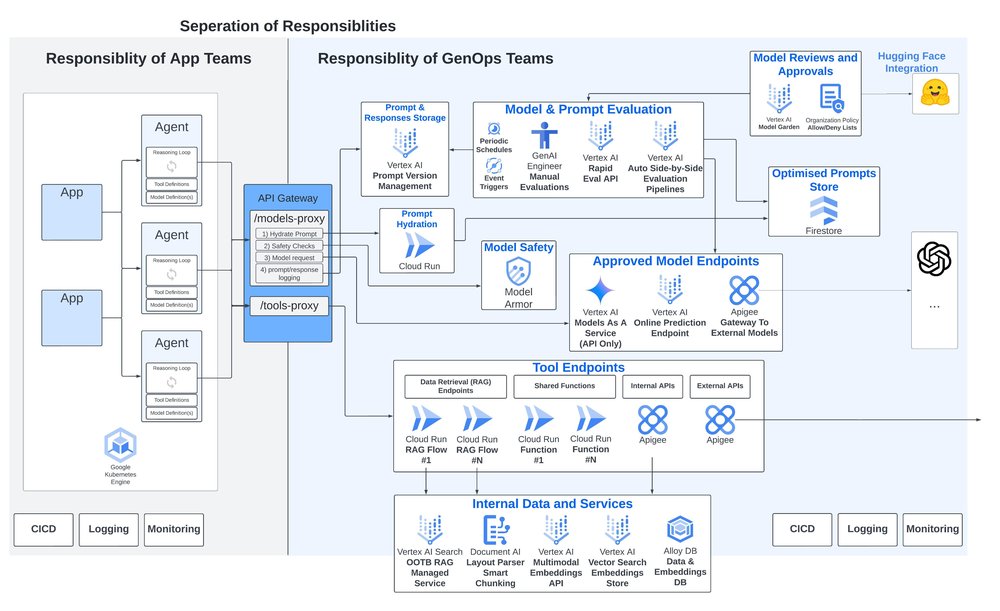
GenOps with Google Cloud
Regardless of size, for any organization to be successful with generative AI, they will need to ensure their generative AI application’s unique characteristics and requirements are well managed, and hence an operational platform engineered to cater for these characteristics and requirements is clearly required. I hope the points discussed in this blog make for helpful consideration as we all navigate through this exciting and highly impactful new era of technology.
If you are interested in learning more, reach out to your Google Cloud account team if you have one, or feel free to contact me directly.
-
Software Engineer, Google
Mon, 26 Aug 2024 16:00:00 -0000
The Terraform Google Provider v6.0.0 is now GA. Since the last major Terraform provider release in September 2023, the combined Hashicorp/Google provider team has been listening closely to the community's feedback. Discussed below are the primary enhancements and bug fixes that this major release focuses on. Support for earlier versions of HashiCorp Terraform will not change as a result of the major version release v6.0.0.
Terraform Google Provider Highlights
The key notable changes are as follows:
-
Opt-out default label “goog-terraform-provisioned”
-
Deletion protection fields added to multiple resources
-
Allowed reducing the suffix length in “name_prefix” for multiple resources
Opt-out default label “goog-terraform-provisioned”
As a follow-up to the addition of provider-level default labels in 5.16.0, the 6.0.0 major release includes an opt-out default label “goog-terraform-provisioned”. This provider-level label “goog-terraform-provisioned” will be added to applicable resources to identify resources that were created by Terraform. This default label will only apply for newly created resources with a labels field. This will enable users to have a view of resources managed by Terraform when viewing/editing these resources in other tools like Cloud Console, Cloud Billing etc.
The label “goog-terraform-provisioned” can be used for the following:
-
To filter on the Billing Reports page:

- To view the Cost breakdown:
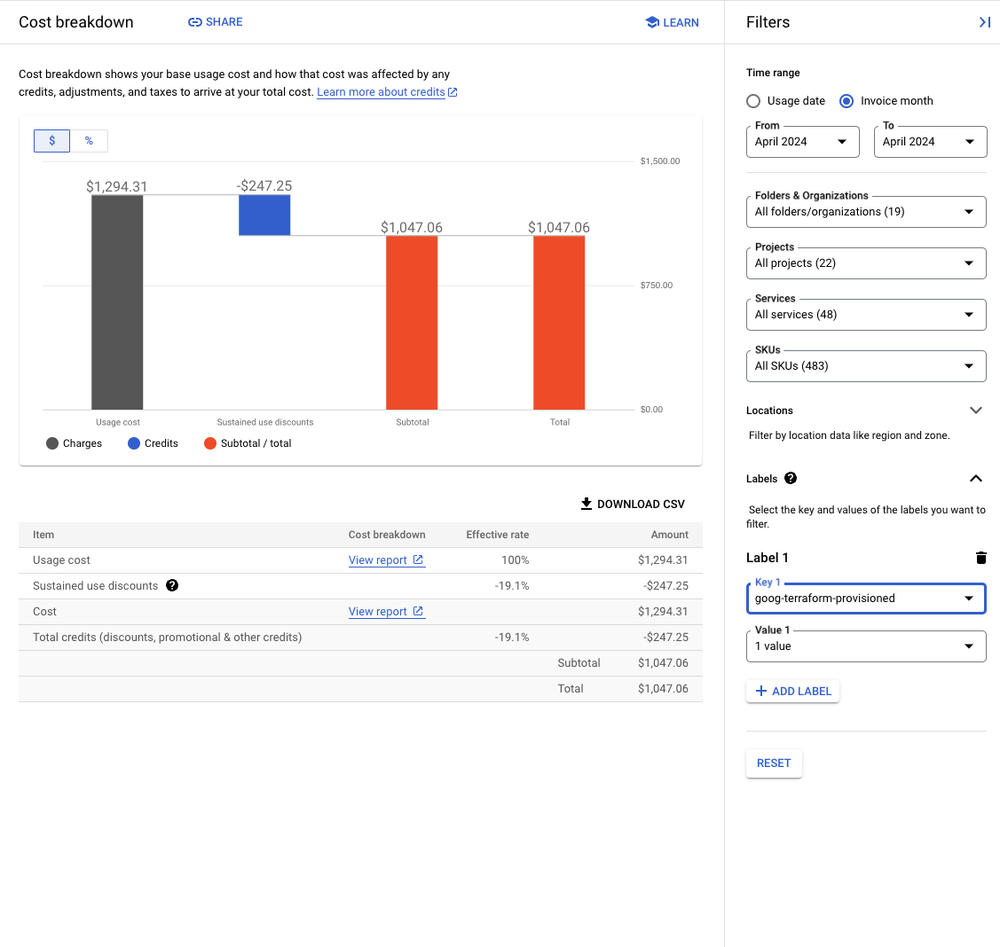
-
The label can also be used with BigQuery export.
Please note that an opt-in version of the label was already released in 5.16.0, and 6.0.0 will change the label to opt-out. To opt-out of this default label, the users may toggle the add_terraform_attribution_label provider configuration field. This can be set explicitly using any release from 5.16.0 onwards and the value in configuration will apply after the 6.0.0 upgrade.
- code_block
- <ListValue: [StructValue([('code', 'provider "google" {\r\n // opt out of “goog-terraform-provisioned” default label\r\n add_terraform_attribution_label = false\r\n}'), ('language', ''), ('caption', <wagtail.rich_text.RichText object at 0x3e60eec65a00>)])]>
Deletion protection fields added to multiple resources
In order to prevent the accidental deletion of important resources, many resources now have a form of deletion protection enabled by default. These resources include google_domain, google_cloud_run_v2_job, google_cloud_run_v2_service, google_folder and google_project. Most of these are enabled by the deletion_protection field. google_project specifically has a deletion_policy field which is set to PREVENT by default.
Allowed reducing the suffix length in “name_prefix”
Another notable issue resolved in this major release is, “Allow reducing the suffix length appended to instance templates name_prefix (#15374 ),” which changes the default behavior for name_prefix in multiple resources. The max length of the user-defined name_prefix has increased from 37 characters to 54. The provider will use a shorter appended suffix when using a name_prefix longer than 37 characters, which should allow for more flexible resource names. For example, google_instance_template.name_prefix.
With features like opt-out default labels and deletion protection, this version enables users to have a view of resources managed by Terraform in other tools and also prevents accidental deletion of important resources. The Terraform Google Provider 6.0.0 launch aims to improve the usability and safety of Terraform for managing Google Cloud resources on Google Cloud. When upgrading to version 6.0 of the Terraform Google Provider, please consult the upgrade guide on the Terraform Registry, which contains a full list of the changes and upgrade considerations. Please check out the Release notes for Terraform Google Provider 6.0.0 for more details on this major version release. Learn more about Terraform on Google Cloud in the Terraform on Google Cloud documentation.
-
CCoE Team Tech Lead, Hakuhodo Technologies Inc.
Mon, 12 Aug 2024 16:00:00 -0000
Hakuhodo Technologies, a specialized technology company of the Hakuhodo DY Group — one of Japan’s leading advertising and media holding companies — is dedicated to enhancing our software development process to deliver new value and experiences to society and consumers through the integration of marketing and technology.
Our IT Infrastructure Team at Hakuhodo Technologies operates cross-functionally, ensuring the stable operation of the public cloud that supports the diverse services within the Hakuhodo DY Group. We also provide expertise and operational support for public cloud initiatives.
Our value is to excel in the cloud and infrastructure domain, exhibiting a strong sense of ownership, and embracing the challenge of creating new value.
Background and challenges
The infrastructure team is tasked with developing and operating the application infrastructure tailored to each internal organization and service, in addition to managing shared infrastructure resources.
Following the principles of platform engineering and site reliability engineering (SRE), each team within the organization has adopted elements of SRE, including the implementation of post-mortems and the development of observability mechanisms. However, we encountered two primary challenges:
-
As the infrastructure expanded, the number of people on the team grew rapidly, bringing in new members from diverse backgrounds. This made it necessary to clarify and standardize tasks, and provide a collective understanding of our current situation and alignment on our goals.
-
We mainly communicate with the app team through a ticket-based system. In addition to expanding our workforce, we have also introduced remote working. As a result, team members may not be as well-acquainted as before. This lack of familiarity could potentially cause small misunderstandings that can escalate quickly.
As our systems and organization expand, we believe that strengthening common understanding and cooperative relationships within the infrastructure team and the application team is essential for sustainable business growth. This has become a core element of our strategy.
We believe that fostering an SRE mindset among both infrastructure and application team members and creating a culture based on that common understanding is essential to solving the issues above. To achieve this, we decided to implement the "SRE Core" program by Google Cloud Consulting, which serves as the first step in adopting SRE practices.
Change
First, through the "SRE Core" program, we revitalized communication between the application and infrastructure teams, which had previously had limited interaction. For example, some aspects of the program required information that was challenging for infrastructure members to gather and understand on their own, making cooperation with the application team essential.
Our critical user journey (CUJ), one of the SRE metrics, was established based on the business requirements of the app and the behavior of actual users. This information is typically managed by the app team, which frequently communicates with the business side. This time, we collaborated with the application team to create a CUJ, set service level indicators (SLIs) and service level objectives (SLOs) which included error budgets, performed risk analysis, and designed the necessary elements for SRE.
This collaborative work and shared understanding served as a starting point. As we continued to build a closer working relationship even after the program ended, with infrastructure members also participating in sprint meetings that had previously been held only for the app team.

Additionally, as an infrastructure team, we systematically learned when and why SRE activities are necessary, allowing us to reflect on and strengthen our SRE efforts that had been partially implemented.
For example, I recently understood that the purpose of postmortems is not only to prevent the recurrence of incidents but also to gain insights from the differences in perspectives between team members. Learning the purpose of postmortems changed our team’s mindset. We now practice immediate improvement activities, such as formalizing the postmortem process, clarifying the creation of tickets for action items, and sharing postmortem minutes with the app team, which were previously kept internal.
We also reaffirmed the importance of observability to consistently review and improve our current system. Regular meetings between the infrastructure and application teams allow us to jointly check metrics, which in turn helps maintain application performance and prevent potential issues.
By elevating our previous partial SRE activities and integrating individual initiatives, the infrastructure team created an organizational activity cycle that has earned more trust. This enhanced cycle is now getting integrated into our original operational workflows.
Future plans
With the experience gained through the SRE Core program, the infrastructure team looks forward to expanding collaboration with application and business teams and increasing proactive activities. Currently, we are starting with collaborations on select applications, but we aim to use these success stories to broaden similar initiatives across the organization.
It is important to remember that each app has different team members, business partners, environments, and cultures, so SRE activities must be tailored to each unique situation. We aim to harmonize and apply the content learned in this program with the understanding that SRE activities are not the goal, but are elements that support the goals of the apps and the business.
Additionally, our company has a Cloud Center of Excellence (CCoE) team dedicated to cross-organizational activities. The CCoE manages a portal site for company-wide information dissemination and a community platform for developers to connect. We plan to share the insights we've gained through these channels with other respective teams within our group companies. As the CCoE's internal activities mature, we also intend to share our knowledge and experiences externally.
Through these initiatives, we hope to continue our activities with the hope that internal members — beyond the CCoE and infrastructure organizations — take psychological safety into consideration during discussions and actions.
Supplement: Regarding psychological safety
At our company, we have a diverse workforce with varying years of experience and perspectives. We believe that ensuring psychological safety is essential for achieving high performance.
When psychological safety is lacking, for instance, if the person delivering bad news is blamed, reports tend to become superficial and do not lead to substantive discussions.
This issue can also arise from psychological barriers, such as the omission of tasks known only to experienced employees, leading to problems caused by the fear of asking for clarification.
In a situation where psychological safety is ensured, we focus on systems rather than individuals, viewing problems as opportunities. For example, if errors occur due to manual work, the manual process itself is seen as the issue. Similarly, if a system failure with no prior similar case arises, it is considered an opportunity to gain new knowledge.
By adopting this mindset, fear is removed from the equation, allowing for unbiased discussions and work.
This allows every employee to perform at their best, regardless of their years of experience. Of course, this is not something that can be achieved through a single person. It will require a whole team or organization to recognize this to make it a reality.
-
EMEA Solutions Lead, Application Modernization
Mon, 05 Aug 2024 16:00:00 -0000
Continuous Delivery (CD) is a set of practices and principles that enables teams to deliver software quickly and reliably by automating the entire software release process using a pipeline. In this article, we explain how to create a Continuous Delivery pipeline to automate software delivery from code commit to production release on Cloud Run using Gitlab CI/CD and Cloud Deploy, leveraging the recently released Gitlab Google Cloud integration.
Elements of the solution
Gitlab CI/CD
GitLab CI/CD is an integrated continuous integration and delivery platform within GitLab. It automates the build, test, and deployment of your code changes, streamlining your development workflow. For more information check the Gitlab CI/CD documentation.
Cloud Deploy
Cloud Deploy is a Google managed service that you can use to automate how your application is deployed across different stages to a series of runtime environments. With Cloud Deploy, you can define delivery pipelines to deploy container images to GKE and Cloud Run targets in a predetermined sequence. Cloud Deploy supports advanced deployment strategies as progressive releases, approvals, deployment verifications, parallel deployments.
Google Cloud Gitlab integration
Gitlab and Google Cloud recently released integrations to make it easier and more secure to deploy code from Gitlab to Google Cloud. The areas of integration described in this article are:
-
Authentication: The GitLab and Google Cloud integration leverages workload identity federation, enabling secure authorization and authentication for GitLab workloads, as CI/CD jobs, with Google Cloud. This eliminates the need for managing service accounts or service account keys, streamlining the process and reducing security risks. All the other integration areas described below leverage this authentication mechanism.
-
Artifact Registry: The integration lets you upload GitLab artifacts to Artifact Registry and access them from Gitlab UI.
-
Cloud Deploy: This Gitlab component facilitates the creation of Cloud Deploy releases from Gitlab CI/CD pipelines.
-
Gcloud: This component facilitates running gcloud commands in Gitlab CI/CD pipelines.
-
Gitlab runners on Google Cloud: The integration lets you configure runner settings from Gitlab UI and have them deployed on your Google Cloud project with Terraform.
You can access the updated list of Google Cloud Gitlab components here.
What you’ll need
To follow the steps in this article you need:
-
A Gitlab account (Free, Premium or Ultimate)
-
A Google Cloud project with project owner access
-
A fork, in your account, of the following Gitlab repository containing the example code: https://gitlab.com/galloro/cd-on-gcp-gl cloned locally to your workstation.
Pipeline flow
You can see the pipeline in the .gitlab-ci.yml file in the root of the repo or using the Gitlab Pipeline editor.
Following the instruction in this article you will create and execute an end to end software delivery pipeline where:
-
A developer creates a feature branch from an application repository
-
The developer makes a change to the code and then opens a merge request to merge the updated code to the main branch
-
The Gitlab pipeline will run the following jobs, all configured to run when a merge request is open through the
- if: $CI_PIPELINE_SOURCE == 'merge_request_event' rule:a. The
image-buildjob, in thebuildstage, builds a container image with the updated code.- code_block
- <ListValue: [StructValue([('code', '# Image build for automatic pipeline running on merge request\r\nimage-build:\r\n image: docker:24.0.5\r\n stage: build\r\n services:\r\n - docker:24.0.5-dind\r\n rules:\r\n - if: $CI_PIPELINE_SOURCE == "web"\r\n when: never\r\n - if: $CI_PIPELINE_SOURCE == \'merge_request_event\'\r\n before_script:\r\n - docker login -u $CI_REGISTRY_USER -p $CI_REGISTRY_PASSWORD $CI_REGISTRY\r\n script:\r\n - docker build -t $GITLAB_IMAGE cdongcp-app/\r\n - docker push $GITLAB_IMAGE\r\n - docker logout'), ('language', ''), ('caption', <wagtail.rich_text.RichText object at 0x3e60ee1f2190>)])]>
b. The
upload-artifact-registrycomponent, in thepushstage, pushes the image to Artifact Registry leveraging the Google Cloud IAM integration configured previously as all the other following components. The configuration of this job, as the ones for the other components described below, is split between the component and the explicit job definition in order to set the rules for job execution.- code_block
- <ListValue: [StructValue([('code', '# Image push to Artifact Registry for automatic pipeline running on merge request\r\n - component: gitlab.com/google-gitlab-components/artifact-registry/upload-artifact-registry@0.1.1\r\n inputs:\r\n stage: push\r\n source: $GITLAB_IMAGE\r\n target: $GOOGLE_AR_REPO/cdongcp-app:$CI_COMMIT_SHORT_SHA'), ('language', ''), ('caption', <wagtail.rich_text.RichText object at 0x3e60ee1f20d0>)])]>
c. The
create-cloud-deploy-releasecomponent, in thedeploy-to-qastage, creates a release on Cloud Deploy and a rollout to the QA stage, mapping to thecdongcp-app-qaCloud Run service, where the QA team will run user acceptance tests.- code_block
- <ListValue: [StructValue([('code', '# Cloud Deploy release creation for automatic pipeline running on merge request\r\n - component: gitlab.com/google-gitlab-components/cloud-deploy/create-cloud-deploy-release@0.1.1 \r\n inputs: \r\n stage: deploy-to-qa\r\n project_id: $GOOGLE_PROJECT\r\n name: cdongcp-$CI_COMMIT_SHORT_SHA\r\n delivery_pipeline: cd-on-gcp-pipeline\r\n region: $GOOGLE_REGION\r\n images: cdongcp-app=$GOOGLE_AR_REPO/cdongcp-app:$CI_COMMIT_SHORT_SHA'), ('language', ''), ('caption', <wagtail.rich_text.RichText object at 0x3e60ee1f25b0>)])]>
4. After the tests are completed, the QA team merges the MR and this runs the
run-gcloudcomponent, in thepromote-to-prodstage, that promotes the release to the production stage, mapping to thecdongcp-app-prodCloud Run service. In this case the job is configured to run on a push to the main branch through the- if: $CI_COMMIT_BRANCH == $CI_DEFAULT_BRANCHrule:- code_block
- <ListValue: [StructValue([('code', '# Cloud Deploy release promotion for automatic pipeline running on merge request\r\n - component: gitlab.com/google-gitlab-components/cloud-sdk/run-gcloud@main\r\n inputs:\r\n stage: promote-to-prod\r\n project_id: $GOOGLE_PROJECT\r\n commands: |\r\n MOST_RECENT_RELEASE=$(gcloud deploy releases list --delivery-pipeline cd-on-gcp-pipeline --region $GOOGLE_REGION --format="value(name)" --limit 1)\r\n gcloud deploy releases promote --delivery-pipeline cd-on-gcp-pipeline --release $MOST_RECENT_RELEASE --region $GOOGLE_REGION'), ('language', ''), ('caption', <wagtail.rich_text.RichText object at 0x3e60ee1f2550>)])]>
5. The Cloud Deploy prod target requires approval so an approval request is triggered, the Product Manager for the application checks the rollout and approves it so the app is released in production with a canary release; this creates a new revision of the
cdongcp-app-prodCloud Run service and direct 50% of the traffic to it. You can see the Cloud Deploy delivery pipeline and targets configuration below (file cr-delivery-pipeline.yaml in the repo) including the canary strategy and approval required for prod deployment. Canary strategy is configured to 50% to make traffic split more visible; in a real production environment this would be a lower number.- code_block
- <ListValue: [StructValue([('code', 'apiVersion: deploy.cloud.google.com/v1\r\nkind: DeliveryPipeline\r\nmetadata:\r\n name: cd-on-gcp-pipeline\r\ndescription: CD on Cloud Run w Gitlab CI and Cloud Deploy - End to end pipeline\r\nserialPipeline:\r\n stages:\r\n - targetId: qa\r\n profiles:\r\n - qa\r\n - targetId: prod\r\n profiles:\r\n - prod\r\n strategy:\r\n canary:\r\n runtimeConfig:\r\n cloudRun:\r\n automaticTrafficControl: true\r\n canaryDeployment:\r\n percentages: [50]\r\n verify: false\r\n---\r\napiVersion: deploy.cloud.google.com/v1\r\nkind: Target\r\nmetadata:\r\n name: prod\r\ndescription: Prod Cloud Run Service\r\nrequireApproval: true\r\nrun:\r\n location: projects/yourproject/locations/yourregion\r\n---\r\napiVersion: deploy.cloud.google.com/v1\r\nkind: Target\r\nmetadata:\r\n name: qa\r\ndescription: QA Cloud Run Service\r\nrun:\r\n location: projects/yourproject/locations/yourregion'), ('language', ''), ('caption', <wagtail.rich_text.RichText object at 0x3e60ee1f2610>)])]>
6. After checking the canary release, the App Release team advances the rollout to 100%.
You can play all the roles described above (developer, member of the QA team, member of the App release team, Product Manager) using a single Gitlab account and project/repository. In a real world scenario multiple accounts would be used.
The picture below describes the pipeline flow:

In addition to the jobs and stages described above, the .gitlab-ci.yml pipeline contains other instances of similar jobs, in the
first-releasestage, that are configured, through rules, to run only if the pipeline is executed manually using the “Run pipeline” button in Gitlab web UI. You will do that to manually create the first release before running the above described flow.Prepare your environment
To prepare your environment to run the pipeline, complete the following tasks:
-
Create an Artifact Registry standard repository for Docker images in your Google Cloud project and desired region.
-
Run
setup.shfrom the setup folder in your local repo clone and follow the prompt to insert your Google Cloud project, Cloud Run and Cloud Deploy region and Artifact Registry repository. Then commit changes to the.gitlab-ci.ymlandsetup/cr-delivery-pipeline.yamlfiles and push them to your fork.
3. Still in the setup folder, create a Cloud Deploy delivery pipeline using the manifest provided (replace
yourregionandyourprojectwith your values):- code_block
- <ListValue: [StructValue([('code', 'gcloud deploy apply --file=cr-delivery-pipeline.yaml --region=yourregion --project=yourproject'), ('language', ''), ('caption', <wagtail.rich_text.RichText object at 0x3e60ee1f2370>)])]>
This creates a pipeline that has two stages: qa and prod, each using a profile with the same name and two targets mapping two Cloud Run services to the pipeline stages.
4. Follow the Gitlab documentation to set up Google Cloud workload identity federation and the workload identity pool that will be used to authenticate Gitlab to Google Cloud services.
5. Follow the Gitlab documentation to set up Google Artifact Registry integration. After that you will be able to access the Google AR Repository from Gitlab UI through the Google Artifact Registry entry in the sidebar under Deploy.
6. (Optional) Follow the Gitlab documentation to set up runners in Google Cloud. If you’re using Gitlab.com, you can also keep the default configuration that uses Gitlab hosted runners, but with Google Cloud runners you can customize parameters as the machine type and autoscaling.
7. Set up permissions for Gitlab Google Cloud components as described in the related README for each component. To run the jobs in this pipeline, the Gitlab workload identity pool must have the following minimum roles in Google Cloud IAM:
-
-
roles/artifactregistry.reader
-
roles/artifactregistry.writer
-
roles/clouddeploy.approver
-
roles/clouddeploy.releaser
-
roles/iam.serviceAccountUser
-
roles/run.admin
-
roles/storage.admin
-
8. Manually run the pipeline from Gitlab web UI with Build -> Pipelines -> Run pipeline to create the first release and the two Cloud Run services for QA and production. This runs all the jobs that are part of the
first-releasestage, and waits for the pipeline execution to complete before moving to the next steps.
9. From the Google Cloud console, get the URL of the cdongcp-app-qa and cdongcp-app-prod Cloud Run services and open them with a web browser to check that the application has been deployed.

Run your pipeline
Update your code as a developer
-
Be sure to move at the root of the repository clone and create a new branch of the repository with the name “new feature” and check it out:
- code_block
- <ListValue: [StructValue([('code', 'git checkout -b new-feature'), ('language', ''), ('caption', <wagtail.rich_text.RichText object at 0x3e60ee1f2ca0>)])]>
2. Update your code: open the app.go file in the cdongcp-app folder and change the message in row 25 to “cd-on-gcp app UPDATED in target: …”
3. Commit and push your changes to the “new-feature” branch.
- code_block
- <ListValue: [StructValue([('code', 'git add cdongcp-app/app.go\r\ngit commit -m "new feature"\r\ngit push origin new-feature'), ('language', ''), ('caption', <wagtail.rich_text.RichText object at 0x3e60ee1f2ee0>)])]>
4. Now open a merge request to merge your code: you can copy and paste to your browser the url in the terminal output and in the Gitlab page click the “Create merge request” button, you will see a pipeline starting.
Run automatic build of your artifact
1. In Gitlab look at Build > Pipelines, click on the last pipeline execution id; you should see three stages each one including one job:

2. Wait for the pipeline to complete; you can click on each job to see the execution log. The last job should create the cdongcp-$COMMIT_SHA release (where $COMMIT_SHA is the short SHA of your commit) and roll it out to the QA stage.
3. Open or refresh the cdongcp-app-qa URL with your browser; you should see the updated application deployed in the QA stage.
4. In a real world scenario the QA team performs some usability tests in this environment. Let’s assume that these have been completed successfully and you, as a member of the QA team this time, want to merge the changed code to the main branch: go to the merge request Gitlab page and click “Merge”.
Approve and rollout your release to production
1. A new pipeline will run containing only one job from the
run-gcloudcomponent. You can see the execution in the Gitlab pipeline list.
2. When the pipeline is completed your release will be promoted to prod stage waiting for approval, as you can see in the Cloud Deploy page in the console.

3. Now, acting as the product manager for the application that has to approve the deployment in production, click on Review; you will see a rollout that needs approval. Click on REVIEW again.
4. In the “Approve rollout to prod” page, click on the “APPROVE” button to finally approve the promotion to the prod stage. The rollout to the canary phase of the prod stage will start, and after some time the rollout will stabilize in the canary phase.
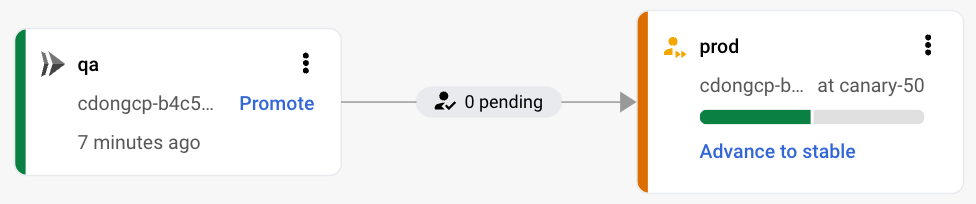
5. Let’s try to observe how traffic is managed in this phase: generate some requests to the cdongcp-app-prod URL service with the following command (replace
cdongcp-app-prod-urlwith your service URL):- code_block
- <ListValue: [StructValue([('code', 'while true; do curl cdongcp-app-prod-url;sleep 1;done'), ('language', ''), ('caption', <wagtail.rich_text.RichText object at 0x3e60ee1f2b80>)])]>
6. After some time you should see responses both from your previous release and the new (canary) one.

7. Now let’s pretend that the App Release team gets metrics and other observability data from the canary. When they are sure that the application is performing correctly, they want to deploy the application to all their users. As a member of the App Release team, go to the Cloud Deploy console and click “Advance to stable” and then “ADVANCE” on the confirmation pop up; the rollout should progress to stable. When the progress stabilizes you will see in the curl output that all the requests are served by the updated version of the application.
Summary
You saw an example Gitlab CI/CD pipeline that leverages the recently released Google Cloud - Gitlab integration to:
-
Configure Gitlab authentication to Google Cloud using workload identity federation
-
Integrate Gitlab with Artifact Registry
-
Use Gitlab CI/CD and Cloud Deploy to automatically build your software and deploy it to a QA Cloud Run service when a merge request is created
-
Automatically promote your software to a prod Cloud Run service when the merge request is merged to the main branch
-
Use approvals in Cloud Deploy
-
Leverage canary release in Cloud Deploy to progressively release your application to users
Now you can reference this article and the documentation on Gitlab CI/CD, Google Cloud - Gitlab integration, Cloud Deploy and Cloud Run to configure your end to end pipeline leveraging Gitlab and Google Cloud!
-
Google Cloud Marketplace Onboarding Manager
Fri, 02 Aug 2024 16:00:00 -0000
Many organizations use Terraform as an Infrastructure-as-Code tool for their cloud migration and modernization journeys. In a previous blog, we shared that you can use Terraform to deploy VM instances from Google Cloud Marketplace, making it easier to discover, procure and deploy enterprise-grade cloud solutions for your organization. Today we are excited to share a step-by-step guide to deploying a VM using a Terraform script from the Google Cloud Marketplace user interface (UI), all in just a few clicks.
Let’s dig in!
Deploying a VM from the Marketplace UI
For a better sense of the experience, let’s take an example — F5 BIG-IP BEST with IPI and Threat Campaigns (PAYG, 25Mbps), an application delivery and security product from our partner F5, Inc. that’s available on the Google Cloud Marketplace. On the product page, you can see pricing, documentation and support information. To start the deployment, click “Get Started”.

After reviewing and accepting the terms of service and the agreements, click the “Agree” button then “Deploy” to move to the deployment page.

The deployment page allows you to review the estimated cost and customize your deployment configuration. You can choose or create a service account with permission to deploy the infrastructure, select the machine type, and configure firewall or network settings. The Terraform UI deployment is then managed by the Google Cloud Infrastructure Manager.
Additionally, you can switch to command-line deployment of the solution from your project, or download the Terraform module to integrate it with your CI/CD pipeline. Once you've completed the configuration, scroll down to the bottom of the page and click "Deploy" to start the deployment process.

You will be navigated to the Solutions page, where you can monitor and manage your deployment via the Google Cloud Marketplace. The time needed to complete the deployment will vary depending on the product. Post deployment, you can do the following actions from the Google Cloud Marketplace Solutions page as follows:
-
View resources
-
View Deployment Details
-
View Deployment Logs
-
Delete the Deployment
-
View suggested next steps
We will talk briefly about these actions in the next section.
Manage your Google Cloud Marketplace deployment
Let’s go through the actions you can take to manage your deployment from the Google Cloud Marketplace UI.

-
The "Resources" tab shows you the provisioned resources and the relevant information to help you locate them in the console. If there were any errors during provisioning, you'll find the related messages here.
-
The "Details" tab provides basic information about your deployment, such as the name, date, location, and output.
-
The "View Logs" button in the top right corner of the page takes you to a new page where you can check the deployment logs. This helps you see how the resources were implemented.
-
To delete the deployment and the provisioned resources, click on the "Delete" button.
-
At the bottom of the page, under the "Suggested next steps" section, you can find additional instructions provided by the solution.
Conclusion
In this blog, we showed you how to deploy a VM using Terraform from the Google Cloud Marketplace UI, eliminating the need for additional, specialized tools. You also have the option of command-line deployment or to download the curated Terraform module for integration into your existing deployment pipelines. Discover and try a wide range of software and solutions, including VMs, on the Google Cloud Marketplace today.
Learn more:
-
Find more VM solutions at Google Cloud Marketplace.
-
Learn more about deploying a Google Cloud Marketplace VM solution.
-
See how to manage infrastructure as code with Terraform, Cloud Build, and GitOps.
-
Learn more about F5 on Google Cloud.
-
For Google Cloud Partners, understand how to onboard your VM solution(s) on Google Cloud Marketplace.
-
Spacelift Applies Generative AI to Infrastructure Automation
Fri, 18 Apr 2025 13:51:39 -0000

 Spacelift, this week, added generative artificial intelligence (AI) capabilities to its platform for automating the management of IT infrastructure provisioned using code.
Postman Adds Hub to Centralize Management of APIs
Fri, 18 Apr 2025 13:17:30 -0000

 Postman this week added a Spec Hub platform to its portfolio that makes it possible to centralize the design, management and maintenance of application programming interface (API) specifications.
AI-Generated Code Packages Can Lead to ‘Slopsquatting’ Threat
Fri, 18 Apr 2025 04:42:51 -0000

 AI hallucinations – the occasional tendency of large language models to respond to prompts with incorrect, inaccurate or made-up answers – have been an ongoing concern as the enterprise adoption of generative AI has accelerated over the past two years. They’re also an issue for developers using AI-based tools when building code, including generating names of packages […]
OpenAI in Talks to Buy Windsurf for $3 Billion: Report
Thu, 17 Apr 2025 18:21:48 -0000

 OpenAI is in talks to acquire Windsurf for about $3 billion, a move that would put it in competition with AI coding assistant providers.
Symbiotic Security Unveils AI Coding Tool Trained to Identify Vulnerabilities
Thu, 17 Apr 2025 17:12:31 -0000

 Symbiotic Security, this week, launched a tool that leverages a large language model (LLM) specifically trained to identify vulnerabilities via a chatbot as application developers write code.
Dynatrace Ushers in the AI-Powered Future of Observability
Wed, 16 Apr 2025 16:13:34 -0000

 Observability has come a long way - Alois Mayr shares his insights on its evolution and how today's AI-driven landscape is reshaping it.
Optimizing CI/CD Pipelines for Developer Happiness and High Performance
Wed, 16 Apr 2025 08:05:36 -0000

 Focusing on DevEx through strategic CI/CD optimization can transform the development lifecycle and significantly improve developer productivity.
Report: Commercial Software Just as Vulnerable as Open Source
Tue, 15 Apr 2025 16:48:38 -0000

 An analysis published by ReversingLabs, a provider of tools for securing application development environments, suggests that commercial software used in software supply chains is just as vulnerable as open-source code.
Five Powerful Ways AI Is Transforming the DevOps Playbook
Tue, 15 Apr 2025 10:32:58 -0000

 The DevOps playbook is rapidly transforming because of recent advancements in artificial intelligence (AI).
MLOps for Green AI: Building Sustainable Machine Learning in the Cloud
Tue, 15 Apr 2025 10:06:09 -0000

 Enter MLOps for Green AI: A fusion of machine learning operations (MLOps) and sustainable DevOps practices that promise to make AI not just smarter, but greener.
Introducing Gemini 2.5 Flash
Thu, 17 Apr 2025 19:02:00 -0000
Gemini 2.5 Flash is our first fully hybrid reasoning model, giving developers the ability to turn thinking on or off.Generate videos in Gemini and Whisk with Veo 2
Tue, 15 Apr 2025 17:00:00 -0000
Transform text-based prompts into high-resolution eight-second videos in Gemini Advanced and use Whisk Animate to turn images into eight-second animated clips.DolphinGemma: How Google AI is helping decode dolphin communication
Mon, 14 Apr 2025 17:00:00 -0000
DolphinGemma, a large language model developed by Google, is helping scientists study how dolphins communicate — and hopefully find out what they're saying, too.Taking a responsible path to AGI
Wed, 02 Apr 2025 13:31:00 -0000
We’re exploring the frontiers of AGI, prioritizing technical safety, proactive risk assessment, and collaboration with the AI community.Evaluating potential cybersecurity threats of advanced AI
Wed, 02 Apr 2025 13:30:00 -0000
Our framework enables cybersecurity experts to identify which defenses are necessary—and how to prioritize themGemini 2.5: Our most intelligent AI model
Tue, 25 Mar 2025 17:00:36 -0000
Gemini 2.5 is our most intelligent AI model, now with thinking built in.Gemini Robotics brings AI into the physical world
Wed, 12 Mar 2025 15:00:00 -0000
Introducing Gemini Robotics and Gemini Robotics-ER, AI models designed for robots to understand, act and react to the physical world.Experiment with Gemini 2.0 Flash native image generation
Wed, 12 Mar 2025 14:58:00 -0000
Native image output is available in Gemini 2.0 Flash for developers to experiment with in Google AI Studio and the Gemini API.Introducing Gemma 3
Wed, 12 Mar 2025 08:00:00 -0000
The most capable model you can run on a single GPU or TPU.Start building with Gemini 2.0 Flash and Flash-Lite
Tue, 25 Feb 2025 18:02:12 -0000
Gemini 2.0 Flash-Lite is now generally available in the Gemini API for production use in Google AI Studio and for enterprise customers on Vertex AIGemini 2.0 is now available to everyone
Wed, 05 Feb 2025 16:00:00 -0000
We’re announcing new updates to Gemini 2.0 Flash, plus introducing Gemini 2.0 Flash-Lite and Gemini 2.0 Pro Experimental.Updating the Frontier Safety Framework
Tue, 04 Feb 2025 16:41:00 -0000
Our next iteration of the FSF sets out stronger security protocols on the path to AGIFACTS Grounding: A new benchmark for evaluating the factuality of large language models
Tue, 17 Dec 2024 15:29:00 -0000
Our comprehensive benchmark and online leaderboard offer a much-needed measure of how accurately LLMs ground their responses in provided source material and avoid hallucinationsState-of-the-art video and image generation with Veo 2 and Imagen 3
Mon, 16 Dec 2024 17:01:16 -0000
We’re rolling out a new, state-of-the-art video model, Veo 2, and updates to Imagen 3. Plus, check out our new experiment, Whisk.Introducing Gemini 2.0: our new AI model for the agentic era
Wed, 11 Dec 2024 15:30:40 -0000
Today, we’re announcing Gemini 2.0, our most capable multimodal AI model yet.Google DeepMind at NeurIPS 2024
Thu, 05 Dec 2024 17:45:00 -0000
Advancing adaptive AI agents, empowering 3D scene creation, and innovating LLM training for a smarter, safer futureGenCast predicts weather and the risks of extreme conditions with state-of-the-art accuracy
Wed, 04 Dec 2024 15:59:00 -0000
New AI model advances the prediction of weather uncertainties and risks, delivering faster, more accurate forecasts up to 15 days aheadGenie 2: A large-scale foundation world model
Wed, 04 Dec 2024 14:23:00 -0000
Generating unlimited diverse training environments for future general agentsAlphaQubit tackles one of quantum computing’s biggest challenges
Wed, 20 Nov 2024 18:00:00 -0000
Our new AI system accurately identifies errors inside quantum computers, helping to make this new technology more reliable.The AI for Science Forum: A new era of discovery
Mon, 18 Nov 2024 19:57:43 -0000
The AI Science Forum highlights AI's present and potential role in revolutionizing scientific discovery and solving global challenges, emphasizing collaboration between the scientific community, policymakers, and industry leaders.Pushing the frontiers of audio generation
Wed, 30 Oct 2024 15:00:00 -0000
Our pioneering speech generation technologies are helping people around the world interact with more natural, conversational and intuitive digital assistants and AI tools.New generative AI tools open the doors of music creation
Wed, 23 Oct 2024 16:53:00 -0000
Our latest AI music technologies are now available in MusicFX DJ, Music AI Sandbox and YouTube ShortsDemis Hassabis & John Jumper awarded Nobel Prize in Chemistry
Wed, 09 Oct 2024 11:45:00 -0000
The award recognizes their work developing AlphaFold, a groundbreaking AI system that predicts the 3D structure of proteins from their amino acid sequences.How AlphaChip transformed computer chip design
Thu, 26 Sep 2024 14:08:00 -0000
Our AI method has accelerated and optimized chip design, and its superhuman chip layouts are used in hardware around the world.Updated production-ready Gemini models, reduced 1.5 Pro pricing, increased rate limits, and more
Tue, 24 Sep 2024 16:03:03 -0000
We’re releasing two updated production-ready Gemini modelsEmpowering YouTube creators with generative AI
Wed, 18 Sep 2024 14:30:06 -0000
New video generation technology in YouTube Shorts will help millions of people realize their creative visionOur latest advances in robot dexterity
Thu, 12 Sep 2024 14:00:00 -0000
Two new AI systems, ALOHA Unleashed and DemoStart, help robots learn to perform complex tasks that require dexterous movementAlphaProteo generates novel proteins for biology and health research
Thu, 05 Sep 2024 15:00:00 -0000
New AI system designs proteins that successfully bind to target molecules, with potential for advancing drug design, disease understanding and more.FermiNet: Quantum physics and chemistry from first principles
Thu, 22 Aug 2024 19:00:00 -0000
Using deep learning to solve fundamental problems in computational quantum chemistry and explore how matter interacts with lightMapping the misuse of generative AI
Fri, 02 Aug 2024 10:50:58 -0000
New research analyzes the misuse of multimodal generative AI today, in order to help build safer and more responsible technologies.Gemma Scope: helping the safety community shed light on the inner workings of language models
Wed, 31 Jul 2024 15:59:19 -0000
Announcing a comprehensive, open suite of sparse autoencoders for language model interpretability.AI achieves silver-medal standard solving International Mathematical Olympiad problems
Thu, 25 Jul 2024 15:29:00 -0000
Breakthrough models AlphaProof and AlphaGeometry 2 solve advanced reasoning problems in mathematicsGoogle DeepMind at ICML 2024
Fri, 19 Jul 2024 10:00:00 -0000
Exploring AGI, the challenges of scaling and the future of multimodal generative AIGenerating audio for video
Mon, 17 Jun 2024 16:00:00 -0000
Video-to-audio research uses video pixels and text prompts to generate rich soundtracksLooking ahead to the AI Seoul Summit
Mon, 20 May 2024 07:00:00 -0000
How summits in Seoul, France and beyond can galvanize international cooperation on frontier AI safetyIntroducing the Frontier Safety Framework
Fri, 17 May 2024 14:00:00 -0000
Our approach to analyzing and mitigating future risks posed by advanced AI modelsGemini breaks new ground: a faster model, longer context and AI agents
Tue, 14 May 2024 17:58:00 -0000
We’re introducing a series of updates across the Gemini family of models, including the new 1.5 Flash, our lightweight model for speed and efficiency, and Project Astra, our vision for the future of AI assistants.New generative media models and tools, built with and for creators
Tue, 14 May 2024 17:57:00 -0000
We’re introducing Veo, our most capable model for generating high-definition video, and Imagen 3, our highest quality text-to-image model. We’re also sharing new demo recordings created with our Music AI Sandbox.Watermarking AI-generated text and video with SynthID
Tue, 14 May 2024 17:56:00 -0000
Announcing our novel watermarking method for AI-generated text and video, and how we’re bringing SynthID to key Google productsAlphaFold 3 predicts the structure and interactions of all of life’s molecules
Wed, 08 May 2024 16:00:00 -0000
Introducing a new AI model developed by Google DeepMind and Isomorphic Labs.Google DeepMind at ICLR 2024
Fri, 03 May 2024 13:39:00 -0000
Developing next-gen AI agents, exploring new modalities, and pioneering foundational learningThe ethics of advanced AI assistants
Fri, 19 Apr 2024 10:00:00 -0000
Exploring the promise and risks of a future with more capable AITacticAI: an AI assistant for football tactics
Tue, 19 Mar 2024 16:03:00 -0000
As part of our multi-year collaboration with Liverpool FC, we develop a full AI system that can advise coaches on corner kicksA generalist AI agent for 3D virtual environments
Wed, 13 Mar 2024 14:00:00 -0000
Introducing SIMA, a Scalable Instructable Multiworld AgentGemma: Introducing new state-of-the-art open models
Wed, 21 Feb 2024 13:06:00 -0000
Gemma is built for responsible AI development from the same research and technology used to create Gemini models.Our next-generation model: Gemini 1.5
Thu, 15 Feb 2024 15:00:00 -0000
The model delivers dramatically enhanced performance, with a breakthrough in long-context understanding across modalities.The next chapter of our Gemini era
Thu, 08 Feb 2024 13:00:00 -0000
We're bringing Gemini to more Google productsAlphaGeometry: An Olympiad-level AI system for geometry
Wed, 17 Jan 2024 16:00:00 -0000
Advancing AI reasoning in mathematicsShaping the future of advanced robotics
Thu, 04 Jan 2024 11:39:00 -0000
Introducing AutoRT, SARA-RT, and RT-TrajectoryImages altered to trick machine vision can influence humans too
Tue, 02 Jan 2024 16:00:00 -0000
In a series of experiments published in Nature Communications, we found evidence that human judgments are indeed systematically influenced by adversarial perturbations.2023: A Year of Groundbreaking Advances in AI and Computing
Fri, 22 Dec 2023 13:30:00 -0000
This has been a year of incredible progress in the field of Artificial Intelligence (AI) research and its practical applications.FunSearch: Making new discoveries in mathematical sciences using Large Language Models
Thu, 14 Dec 2023 16:00:00 -0000
In a paper published in Nature, we introduce FunSearch, a method for searching for “functions” written in computer code, and find new solutions in mathematics and computer science. FunSearch works by pairing a pre-trained LLM, whose goal is to provide creative solutions in the form of computer code, with an automated “evaluator”, which guards against hallucinations and incorrect ideas.Google DeepMind at NeurIPS 2023
Fri, 08 Dec 2023 15:01:00 -0000
The Neural Information Processing Systems (NeurIPS) is the largest artificial intelligence (AI) conference in the world. NeurIPS 2023 will be taking place December 10-16 in New Orleans, USA.Teams from across Google DeepMind are presenting more than 150 papers at the main conference and workshops.Introducing Gemini: our largest and most capable AI model
Wed, 06 Dec 2023 15:13:00 -0000
Making AI more helpful for everyoneMillions of new materials discovered with deep learning
Wed, 29 Nov 2023 16:04:00 -0000
We share the discovery of 2.2 million new crystals – equivalent to nearly 800 years’ worth of knowledge. We introduce Graph Networks for Materials Exploration (GNoME), our new deep learning tool that dramatically increases the speed and efficiency of discovery by predicting the stability of new materials.Transforming the future of music creation
Thu, 16 Nov 2023 07:20:00 -0000
Announcing our most advanced music generation model and two new AI experiments, designed to open a new playground for creativityEmpowering the next generation for an AI-enabled world
Wed, 15 Nov 2023 10:00:00 -0000
Experience AI's course and resources are expanding on a global scaleGraphCast: AI model for faster and more accurate global weather forecasting
Tue, 14 Nov 2023 15:00:00 -0000
We introduce GraphCast, a state-of-the-art AI model able to make medium-range weather forecasts with unprecedented accuracyA glimpse of the next generation of AlphaFold
Tue, 31 Oct 2023 13:00:00 -0000
Progress update: Our latest AlphaFold model shows significantly improved accuracy and expands coverage beyond proteins to other biological molecules, including ligands.Evaluating social and ethical risks from generative AI
Thu, 19 Oct 2023 15:00:00 -0000
Introducing a context-based framework for comprehensively evaluating the social and ethical risks of AI systemsScaling up learning across many different robot types
Tue, 03 Oct 2023 15:00:00 -0000
Robots are great specialists, but poor generalists. Typically, you have to train a model for each task, robot, and environment. Changing a single variable often requires starting from scratch. But what if we could combine the knowledge across robotics and create a way to train a general-purpose robot?A catalogue of genetic mutations to help pinpoint the cause of diseases
Tue, 19 Sep 2023 13:37:00 -0000
New AI tool classifies the effects of 71 million ‘missense’ mutations.Identifying AI-generated images with SynthID
Tue, 29 Aug 2023 00:00:00 -0000
New tool helps watermark and identify synthetic images created by ImagenRT-2: New model translates vision and language into action
Fri, 28 Jul 2023 00:00:00 -0000
Robotic Transformer 2 (RT-2) is a novel vision-language-action (VLA) model that learns from both web and robotics data, and translates this knowledge into generalised instructions for robotic control.Using AI to fight climate change
Fri, 21 Jul 2023 00:00:00 -0000
AI is a powerful technology that will transform our future, so how can we best apply it to help combat climate change and find sustainable solutions?Google DeepMind’s latest research at ICML 2023
Thu, 20 Jul 2023 00:00:00 -0000
Exploring AI safety, adaptability, and efficiency for the real worldDeveloping reliable AI tools for healthcare
Mon, 17 Jul 2023 00:00:00 -0000
We’ve published our joint paper with Google Research in Nature Medicine, which proposes CoDoC (Complementarity-driven Deferral-to-Clinical Workflow), an AI system that learns when to rely on predictive AI tools or defer to a clinician for the most accurate interpretation of medical images.Exploring institutions for global AI governance
Tue, 11 Jul 2023 00:00:00 -0000
New white paper investigates models and functions of international institutions that could help manage opportunities and mitigate risks of advanced AI.RoboCat: A self-improving robotic agent
Tue, 20 Jun 2023 00:00:00 -0000
Robots are quickly becoming part of our everyday lives, but they’re often only programmed to perform specific tasks well. While harnessing recent advances in AI could lead to robots that could help in many more ways, progress in building general-purpose robots is slower in part because of the time needed to collect real-world training data. Our latest paper introduces a self-improving AI agent for robotics, RoboCat, that learns to perform a variety of tasks across different arms, and then self-generates new training data to improve its technique.YouTube: Enhancing the user experience
Fri, 16 Jun 2023 14:55:00 -0000
It’s all about using our technology and research to help enrich people’s lives. Like YouTube — and its mission to give everyone a voice and show them the world.Google Cloud: Driving digital transformation
Wed, 14 Jun 2023 14:51:00 -0000
Google Cloud empowers organizations to digitally transform themselves into smarter businesses. It offers cloud computing, data analytics, and the latest artificial intelligence (AI) and machine learning tools.MuZero, AlphaZero, and AlphaDev: Optimizing computer systems
Mon, 12 Jun 2023 14:41:00 -0000
How MuZero, AlphaZero, and AlphaDev are optimizing the computing ecosystem that powers our world of devices.AlphaDev discovers faster sorting algorithms
Wed, 07 Jun 2023 00:00:00 -0000
New algorithms will transform the foundations of computingAn early warning system for novel AI risks
Thu, 25 May 2023 00:00:00 -0000
New research proposes a framework for evaluating general-purpose models against novel threatsDeepMind’s latest research at ICLR 2023
Thu, 27 Apr 2023 00:00:00 -0000
Next week marks the start of the 11th International Conference on Learning Representations (ICLR), taking place 1-5 May in Kigali, Rwanda. This will be the first major artificial intelligence (AI) conference to be hosted in Africa and the first in-person event since the start of the pandemic. Researchers from around the world will gather to share their cutting-edge work in deep learning spanning the fields of AI, statistics and data science, and applications including machine vision, gaming and robotics. We’re proud to support the conference as a Diamond sponsor and DEI champion.How can we build human values into AI?
Mon, 24 Apr 2023 00:00:00 -0000
Drawing from philosophy to identify fair principles for ethical AI...Announcing Google DeepMind
Thu, 20 Apr 2023 00:00:00 -0000
DeepMind and the Brain team from Google Research will join forces to accelerate progress towards a world in which AI helps solve the biggest challenges facing humanity.Competitive programming with AlphaCode
Thu, 08 Dec 2022 00:00:00 -0000
Solving novel problems and setting a new milestone in competitive programming.AI for the board game Diplomacy
Tue, 06 Dec 2022 00:00:00 -0000
Successful communication and cooperation have been crucial for helping societies advance throughout history. The closed environments of board games can serve as a sandbox for modelling and investigating interaction and communication – and we can learn a lot from playing them. In our recent paper, published today in Nature Communications, we show how artificial agents can use communication to better cooperate in the board game Diplomacy, a vibrant domain in artificial intelligence (AI) research, known for its focus on alliance building.Mastering Stratego, the classic game of imperfect information
Thu, 01 Dec 2022 00:00:00 -0000
Game-playing artificial intelligence (AI) systems have advanced to a new frontier.DeepMind’s latest research at NeurIPS 2022
Fri, 25 Nov 2022 00:00:00 -0000
NeurIPS is the world’s largest conference in artificial intelligence (AI) and machine learning (ML), and we’re proud to support the event as Diamond sponsors, helping foster the exchange of research advances in the AI and ML community. Teams from across DeepMind are presenting 47 papers, including 35 external collaborations in virtual panels and poster sessions.Building interactive agents in video game worlds
Wed, 23 Nov 2022 00:00:00 -0000
Most artificial intelligence (AI) researchers now believe that writing computer code which can capture the nuances of situated interactions is impossible. Alternatively, modern machine learning (ML) researchers have focused on learning about these types of interactions from data. To explore these learning-based approaches and quickly build agents that can make sense of human instructions and safely perform actions in open-ended conditions, we created a research framework within a video game environment.Today, we’re publishing a paper [INSERT LINK] and collection of videos, showing our early steps in building video game AIs that can understand fuzzy human concepts – and therefore, can begin to interact with people on their own terms.Benchmarking the next generation of never-ending learners
Tue, 22 Nov 2022 00:00:00 -0000
Learning how to build upon knowledge by tapping 30 years of computer vision researchBest practices for data enrichment
Wed, 16 Nov 2022 00:00:00 -0000
Building a responsible approach to data collection with the Partnership on AI...Stopping malaria in its tracks
Thu, 13 Oct 2022 15:00:00 -0000
Developing a vaccine that could save hundreds of thousands of livesMeasuring perception in AI models
Wed, 12 Oct 2022 00:00:00 -0000
Perception – the process of experiencing the world through senses – is a significant part of intelligence. And building agents with human-level perceptual understanding of the world is a central but challenging task, which is becoming increasingly important in robotics, self-driving cars, personal assistants, medical imaging, and more. So today, we’re introducing the Perception Test, a multimodal benchmark using real-world videos to help evaluate the perception capabilities of a model.How undesired goals can arise with correct rewards
Fri, 07 Oct 2022 00:00:00 -0000
As we build increasingly advanced artificial intelligence (AI) systems, we want to make sure they don’t pursue undesired goals. Such behaviour in an AI agent is often the result of specification gaming – exploiting a poor choice of what they are rewarded for. In our latest paper, we explore a more subtle mechanism by which AI systems may unintentionally learn to pursue undesired goals: goal misgeneralisation (GMG). GMG occurs when a system's capabilities generalise successfully but its goal does not generalise as desired, so the system competently pursues the wrong goal. Crucially, in contrast to specification gaming, GMG can occur even when the AI system is trained with a correct specification.Discovering novel algorithms with AlphaTensor
Wed, 05 Oct 2022 00:00:00 -0000
In our paper, published today in Nature, we introduce AlphaTensor, the first artificial intelligence (AI) system for discovering novel, efficient, and provably correct algorithms for fundamental tasks such as matrix multiplication. This sheds light on a 50-year-old open question in mathematics about finding the fastest way to multiply two matrices. This paper is a stepping stone in DeepMind’s mission to advance science and unlock the most fundamental problems using AI. Our system, AlphaTensor, builds upon AlphaZero, an agent that has shown superhuman performance on board games, like chess, Go and shogi, and this work shows the journey of AlphaZero from playing games to tackling unsolved mathematical problems for the first time.Fighting osteoporosis before it starts
Tue, 27 Sep 2022 14:16:00 -0000
Detecting signs of disease before bones start to breakUnderstanding the faulty proteins linked to cancer and autism
Mon, 26 Sep 2022 15:19:00 -0000
Helping uncover how protein mutations cause diseases and disordersSolving the mystery of how an ancient bird went extinct
Thu, 22 Sep 2022 15:27:00 -0000
Creating a tool to study extinct species from 50,000 years agoBuilding safer dialogue agents
Thu, 22 Sep 2022 00:00:00 -0000
In our latest paper, we introduce Sparrow – a dialogue agent that’s useful and reduces the risk of unsafe and inappropriate answers. Our agent is designed to talk with a user, answer questions, and search the internet using Google when it’s helpful to look up evidence to inform its responses.Targeting early-onset Parkinson’s with AI
Wed, 21 Sep 2022 15:37:00 -0000
Predictions that pave the way to new treatmentsHow our principles helped define AlphaFold’s release
Wed, 14 Sep 2022 00:00:00 -0000
Our Operating Principles have come to define both our commitment to prioritising widespread benefit, as well as the areas of research and applications we refuse to pursue. These principles have been at the heart of our decision making since DeepMind was founded, and continue to be refined as the AI landscape changes and grows. They are designed for our role as a research-driven science company and consistent with Google’s AI principles.Maximising the impact of our breakthroughs
Fri, 09 Sep 2022 00:00:00 -0000
Colin, CBO at DeepMind, discusses collaborations with Alphabet and how we integrate ethics, accountability, and safety into everything we do.In conversation with AI: building better language models
Tue, 06 Sep 2022 00:00:00 -0000
Our new paper, In conversation with AI: aligning language models with human values, explores a different approach, asking what successful communication between humans and an artificial conversational agent might look like and what values should guide conversation in these contexts.From motor control to embodied intelligence
Wed, 31 Aug 2022 00:00:00 -0000
Using human and animal motions to teach robots to dribble a ball, and simulated humanoid characters to carry boxes and play footballAdvancing conservation with AI-based facial recognition of turtles
Thu, 25 Aug 2022 00:00:00 -0000
We came across Zindi – a dedicated partner with complementary goals – who are the largest community of African data scientists and host competitions that focus on solving Africa’s most pressing problems. Our Science team’s Diversity, Equity, and Inclusion (DE&I) team worked with Zindi to identify a scientific challenge that could help advance conservation efforts and grow involvement in AI. Inspired by Zindi’s bounding box turtle challenge, we landed on a project with the potential for real impact: turtle facial recognition.Discovering when an agent is present in a system
Thu, 18 Aug 2022 00:00:00 -0000
We want to build safe, aligned artificial general intelligence (AGI) systems that pursue the intended goals of its designers. Causal influence diagrams (CIDs) are a way to model decision-making situations that allow us to reason about agent incentives. By relating training setups to the incentives that shape agent behaviour, CIDs help illuminate potential risks before training an agent and can inspire better agent designs. But how do we know when a CID is an accurate model of a training setup?The race to cure a billion people from a deadly parasitic disease
Thu, 28 Jul 2022 16:49:00 -0000
Accelerating the search for life saving leishmaniasis treatments